- 3 Minutes to read
- Print
- DarkLight
- PDF
Create Your Own Custom Metrics
- 3 Minutes to read
- Print
- DarkLight
- PDF
Retrace makes it easy to track and monitor any number of custom metrics, business Key Performance Indicators (KPIs), and other important application events. It can monitor, trend, and set up alerts as it provides insights into the application or its users' behavior.
Why Custom Metrics with Retrace?
There are many ways to track application metrics. Some include Windows Performance Counters, JMX MBeans, StatsD, and a myriad of other solutions. Our system automatically creates the metric, reports and collects the data from your app, sends it to our system, and allows full charting, monitoring and alerting. It works no matter where your app is deployed and no additional tools are required to be installed on your servers.
Retrace simplifies the process by adding only a couple lines of code to your app.
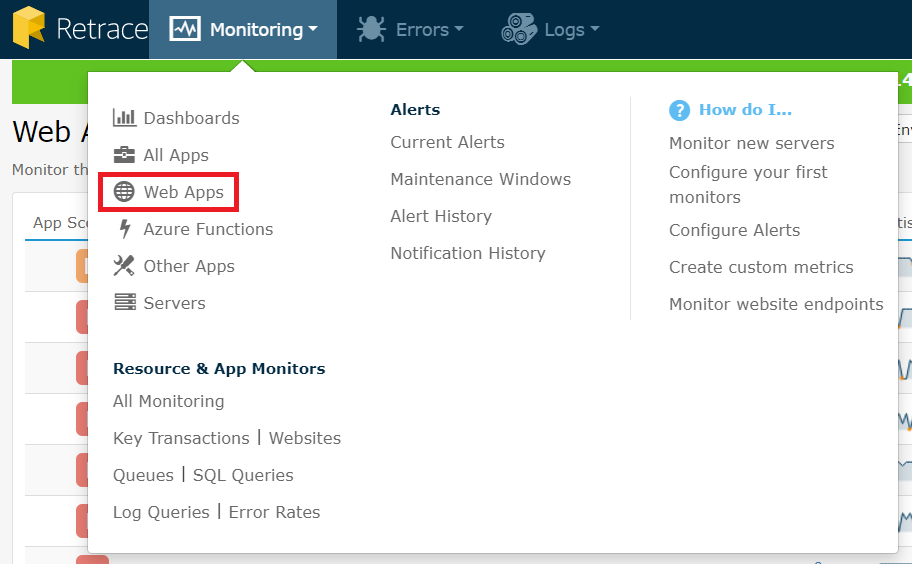
Once executed you can find the created metrics by clicking the Monitoring tab. Then, click on the Web Apps link.

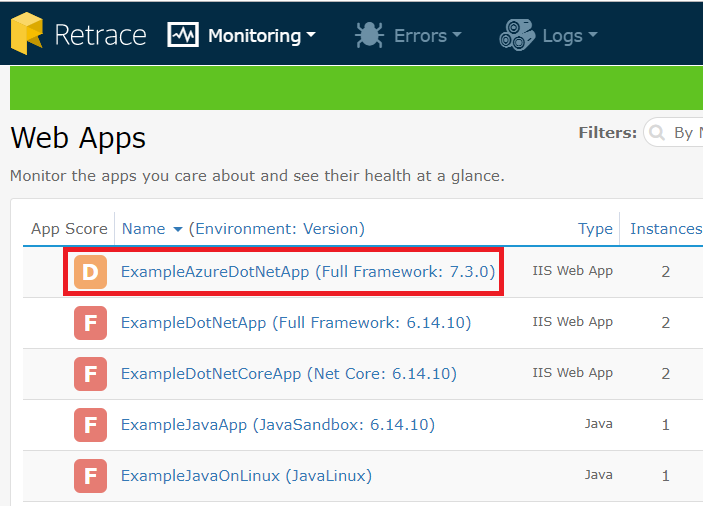
Select an app from the list:

Click on the Monitoring tab then, click the highlighted icon as shown below:
![]()
Under the App Name, click on the highlighted icon next to Servers.
![]()
Next, click on the highlighted icon.
![]()
Examples of Custom Metrics Usage
Use Custom metrics in a variety of ways. Here are some common examples of how and why you would use custom metrics within your application.
Learn more from our blog: When & How to Use Custom Application Metrics
Count How Often a Certain Event Happens
This is used to track how often someone logs in to your application. For example, the number of log messages our platform ingests per minute. The ability to monitor these metrics makes it easy to determine whether the numbers are a lot higher or lower than anticipated.

Track How Long a Transaction Takes
A good example of this is tracking how long specific parts of your code takes. For example, we use it to track how long it takes to process a message being read and processed off a queue. We also use it to track the latency of how long the items were in the queue.
One of the best uses is to track how long it takes to execute a specific Elasticsearch, MongoDB, or SQL query.

Gauge Based Metrics
Gauge metrics are used to report the current value of a created metric.
It is used to track how many concurrent messages are processed off a queue. When we start processing we increment a metric, when we are done, we decrement it. Over time we can see how many we concurrently process.

Requirements for Using Custom Metrics
The following are needed for using Stackify's Custom Metrics functionality:
- There must be an agent running on the server where the application is running.
- The app that you are setting up needs to be registered by the agent so that it appears in the Apps page of Stackify.
- You must use your Retrace Activation Key in one of our supported API libraries
Supported API Libraries
Types of Custom Metrics
- Gauge: Keeps track of the last value that was set in the current minute
- Counter: Calculates the rate per minute
- Average: Calculates the average of all values in the current minute
- Sum: Calculates the total sum of all values in the current minute
- Timer: Calculates the average elapsed time for an operation in the current minute
The code varies by programming languages but is very simple. With a 1-2 lines of code you record a wide array of custom application metrics. Our libraries and Retrace take care of automatically adding the metrics to your application instances.
StackifyLib.Metrics.Count("Users", "Login Success");
Configuring Alert Thresholds
Once the data starts feeding to Retrace, you can then configure the alert thresholds on the values that report from the application's monitoring configuration screen. For more information on App Configuration, take a look at the Configuring App Monitors article. By setting these thresholds with values that make sense for each individual metric, you will be alerted with a Warning, Critical, or Outage, depending on the setup.

