The Alert Modal is the view that appears when you click into an Alert's details. There are several ways to access the Alert details, in this document we will only go over the different aspects of the Modal itself. For more information on accessing the Alert details see Alerts and Notifications: Overview. 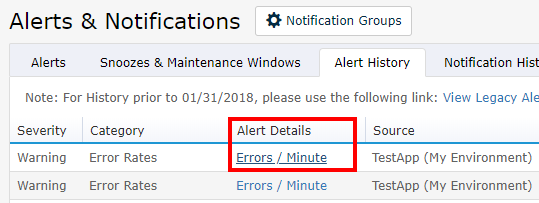
Alert Details Overview
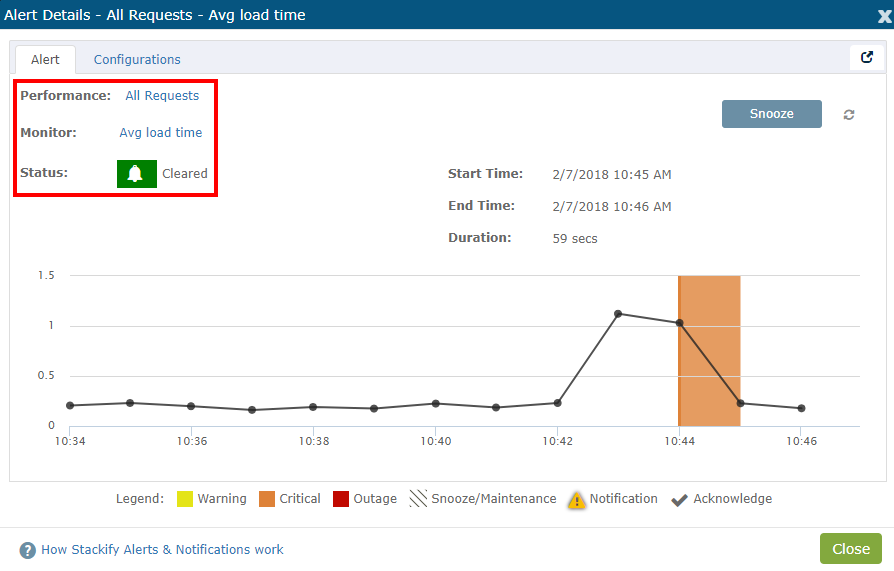
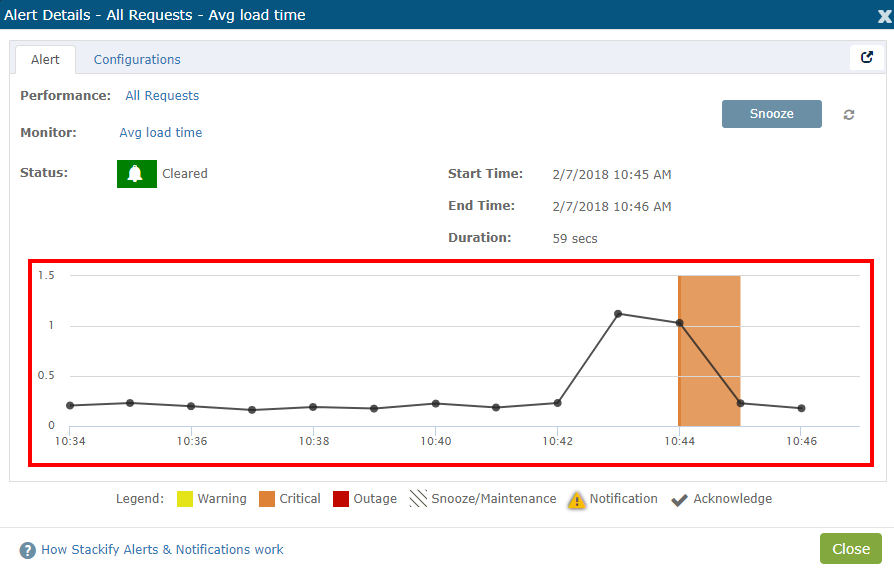
Here in the Alert Modal you can see information in the top left about the monitor and the current status of the alert. In this case "Performance: All Requests" is the Parent category of the monitor and "Monitor: Avg load time" is the Sub Category.
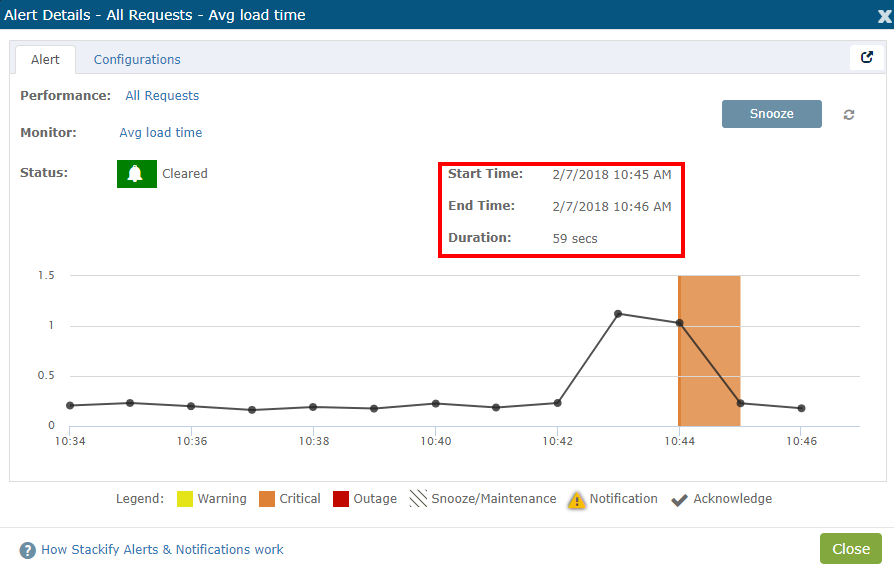
Here you have the Start Time, End Time, and Duration of the Alert. Duration is simply the difference between the Start and End Times.
The monitor graph is the main source of information in the Alert Modal. Here you can see the points of data for the associated monitor as well as when the Alert started occurring. In this instance the color of the Alert is orange due to it's severity (Critical). You can use the legend below the graph for a quick reference of the different types of statuses for the Alert.
Escalations
When an alert transitions from one severity to another you can see that transition in the Alert Modal. There will be a darker line to mark the start of transition and the color will span over the time that the alert was at that severity. 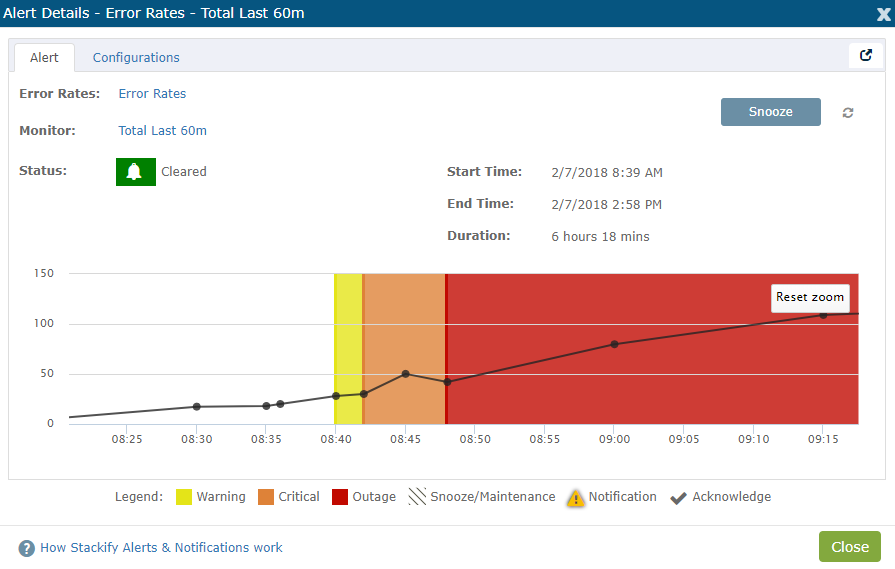
Snoozing/Maintenance Windows
When the alert is snoozed or there is a maintenance window active that effects the alert, you will see gray slashes through the area of the graph where the alert was snoozed. 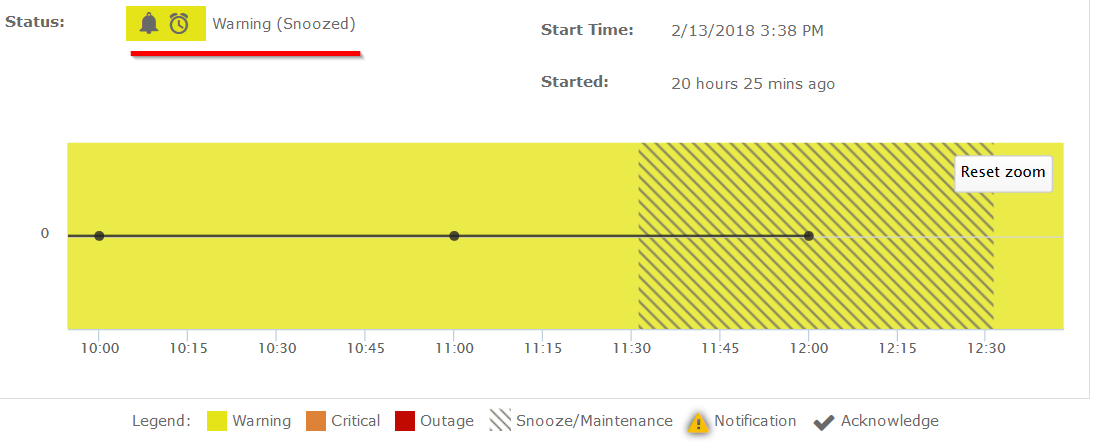
Notifications and Acknowledgements
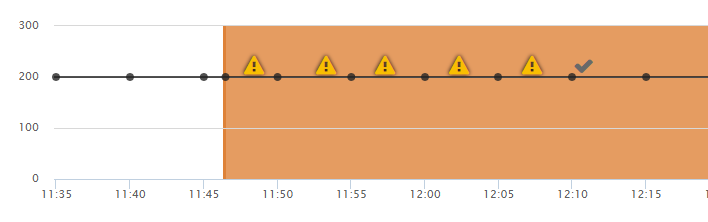
When you receive a Notification from Retrace a marker will be placed in the Alert Modal (caution sign) as well with a Notification Acknowledgement (the check mark). In this case we see a caution mark every five minutes which reflects the reminder settings of the Notification Group.