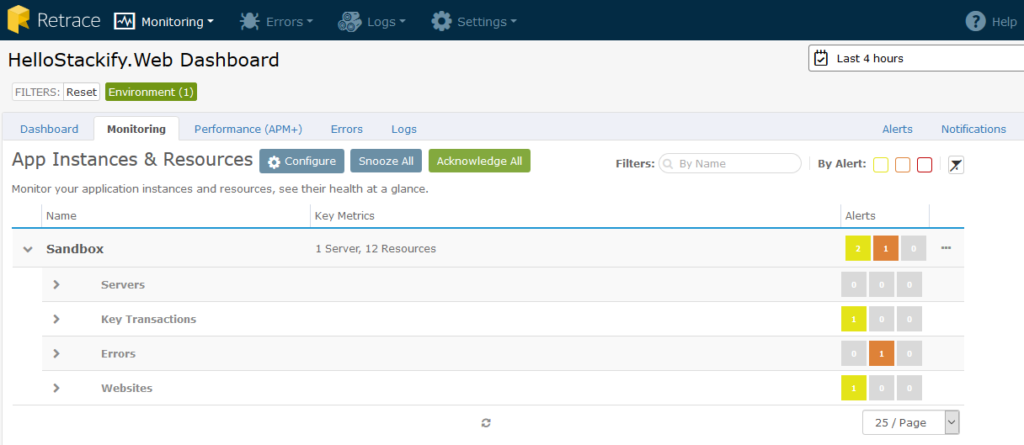
Once you see your apps in Retrace, you will be able load the App's Dashboard by clicking on the app's name and configure monitors and alerts so you can be notified of any issues that may arise. You can expand the Environment name to view Servers, Key Transactions, Errors, and Website metrics that are associated with that App/Environment combination.
Configuring App Monitors
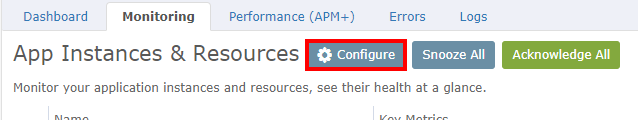
By clicking on Configure, you can set up a variety of different monitors specific to the App and you can apply these monitors across one or more of your Environments.
The monitors you can configure include:
- App-Level Processes/Services
- Key Transactions
- Server (including File and Disk)
- Performance Counter (Windows) or MBeans (Java)
- Custom Metrics
- Errors
- Resource (including Azure Queues, Database Queries, and Website Checks)
- Assigned Notification Groups
To see a more in-depth guide for configuring each of these different monitors at the app level, see the next article App Monitors: Configure.
Acknowledge / Snooze for App + Environment(s)
You can Acknowledge or Snooze alerts globally for a given App within the selected Environments, as depicted here, or individually (see below).
- Acknowledging will silence an Alert until it has resolved and then reoccurs.
- Snoozing an Alert will simply silence it for a specified amount of time.
It's important to note that Acknowledging is a global action. Snoozing can be either for the current user only, or for everyone who is configured to receive Notifications on that Monitor when it is in Alert status. You can read more on Alerts and Notifications here.
Acknowledge / Snooze for Single Monitor
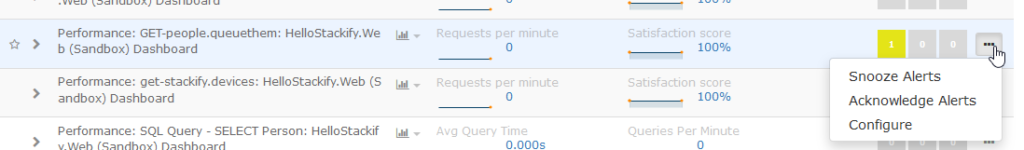
Also note that you can Acknowledge or Snooze a single Alert by finding the monitor and clicking the drop-down to select your desired action.
Servers
Under Servers, you will see all the servers running the current App, as well as a roll-up of any Monitors currently in Alert status.
When you expand a Server, at the top you see App-specific information such as the app's config file and Server monitors. Notice that all of the links will give you access to the path of where the file lives on the server.

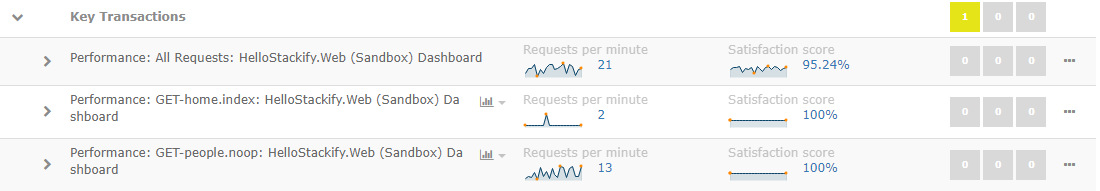
Key Transactions
Here you are able to view all Key Transactions that relate to this App/Environment combination. For more information on Key Transactions take a look at Monitors: Key Transactions
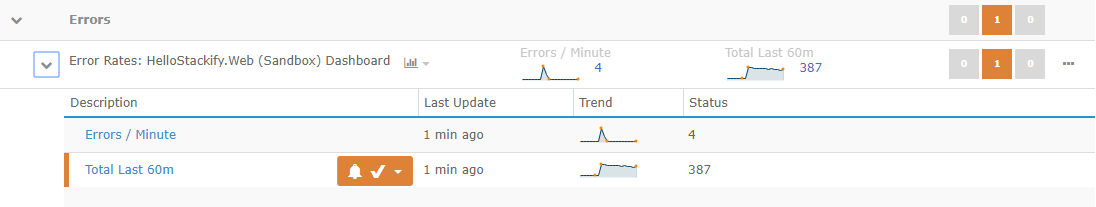
Errors
Here you are able to view the Error rates that relate to this App/Environment combination.
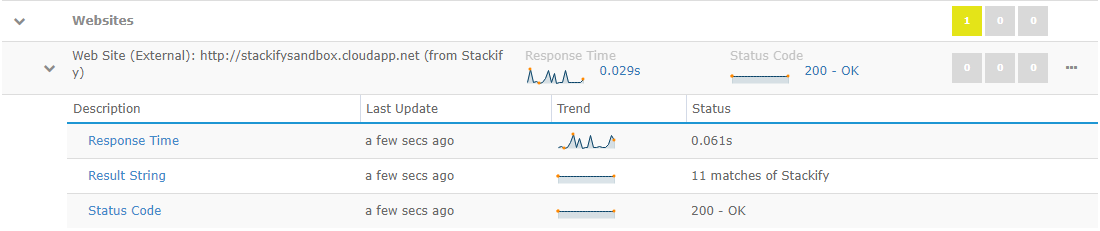
Websites
Here you are able to view all Website monitors that relate to this App/Environment combination. For more information on Website Monitors take a look at Monitors: Web Sites
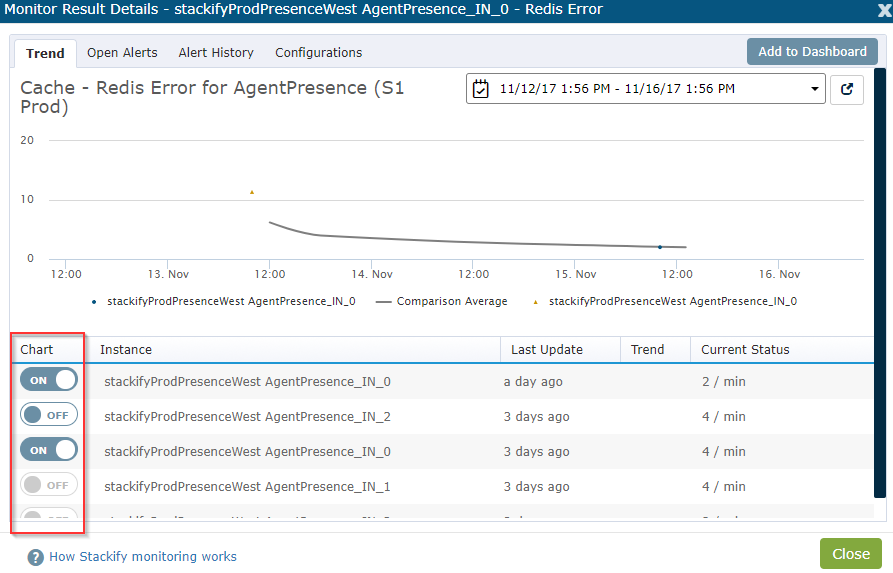
On any of these monitors, clicking the monitor will bring up a dialog that allows you to inspect further the behavior over a recent time frame, as well as pulling in more metrics for comparison. When you have an App living on two or more servers, you can compare that particular metric across any or all servers. Toggling on other charts will overlay onto the first, and you can also see a comparison average.