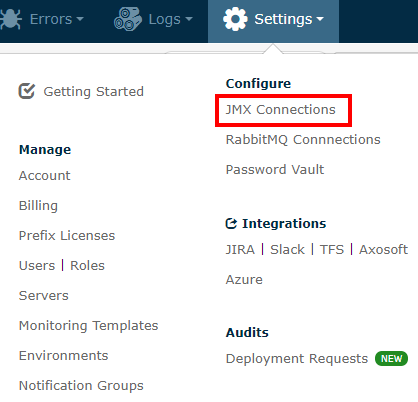
Here are instructions on how to add you JMX connection in the Retrace portal so you can view and create monitors around MBeans on your applications. To start go to Settings > Configure > JMX Connections.
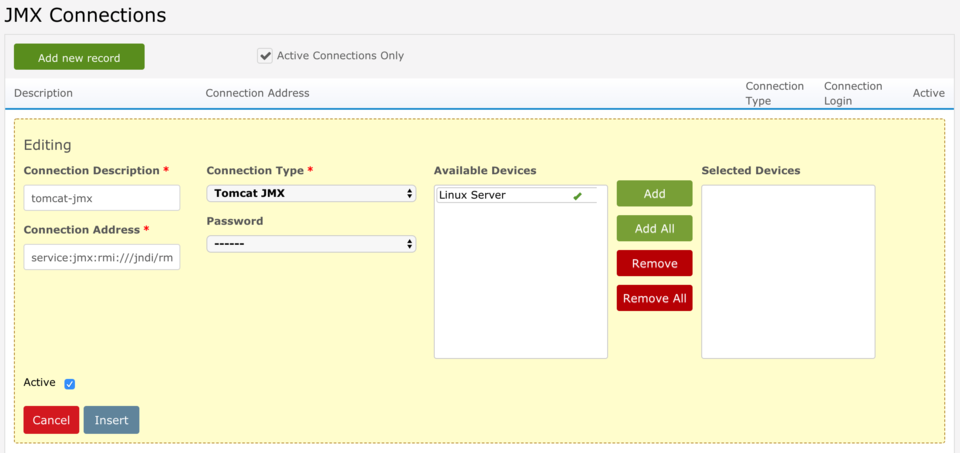
How to Add a JMX Connection for Tomcat or Glassfish
- Name your JMX connection.
- Enter your Connection Address. An example of a standard Tomcat/Glassfish connection address would be:
service:jmx:rmi:///jndi/rmi://localhost:3111/jmxrmi
- Select the Connection Type as Tomcat JMX
- If the connection is authenticated, choose the password for your connection in the dropdown box. (To learn how to setup passwords within Stackify, see the article on Passwords.)
- Add the appropriate device that corresponds to the JMX connection to the Selected Devices panel.
- Finally, click "Insert" to save the connection.
JMX Auto-Discovery
Stackify will automatically try to see if Tomcat has any existing JMX connections not using a username and password. If a new connection is available, this connection will be added and stored into your Stackify account under JMX Connections in Settings of the Stackify portal.
Note: Auto-Discovery of JMX connections currently only work with Tomcat connections and a generated connection name will be given.
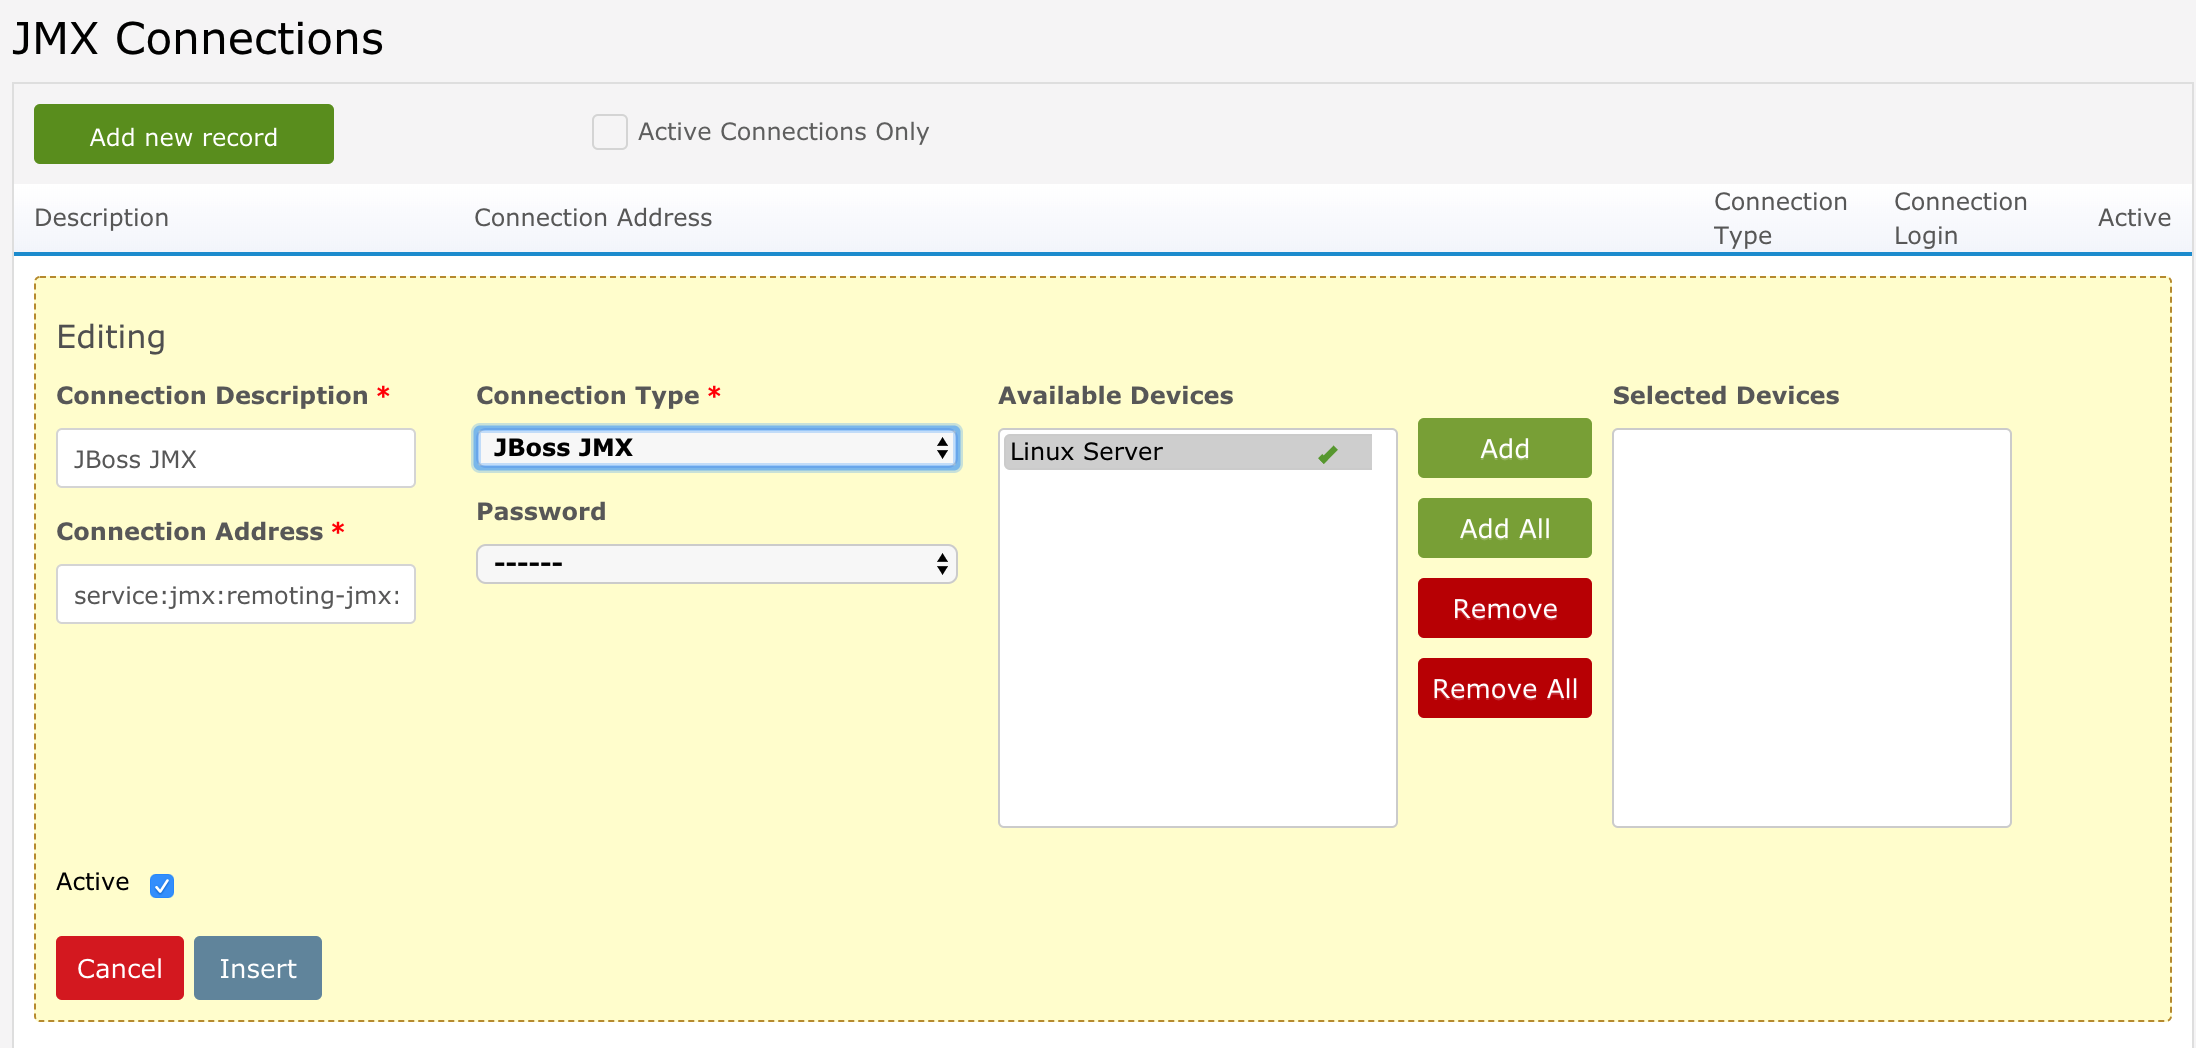
JBoss Connections
Creating a JBoss connection is done in a similar way as creating a Tomcat connection, with the exception of the connection address and type: 1. An example of a standard JBoss connection address would be:
service:jmx:remoting-jmx://localhost:9999
- Select the Connection Type as JBoss JMX
You will also need to add some external jar files to the Stackify configuration file, as shown below.
Adding External Jars
In order to monitor apps in the JBoss container, you have to add the path of the JBoss JMX jars to a Stackify configuration file. Here are the following steps:
- Locate the full path to all your JBoss JMX jar files. The path for these files can be found by running the JBoss JConsole script located in the /bin directory of JBoss:
sudo ./jconsole.sh
The output of this command with give you the paths of all the jars you will need to add to the "STACKIFY_AGENT_EXTERNAL_JARS=" line of the Stackify configuration file in step 2. 2. Navigate to the /usr/local/stackify/stackify-agent directory on your server and modify the stackify-agent-external file by uncommenting the line STACKIFY_AGENT_EXTERNAL_JARS= and add the contents of JBoss CLASSPATH (excluding the non- JBoss jars: /usr/lib/jvm/java-1.6.0-openjdk/lib/jconsole.jar:/usr/lib/jvm/java-1.6.0-openjdk/lib/tools.jar:) 3. Restart the agent by running the command:
sudo service stackify-agent restart
Note: Stackify must have read privileges on the jar files as well as execute privileges on all directories in the path.
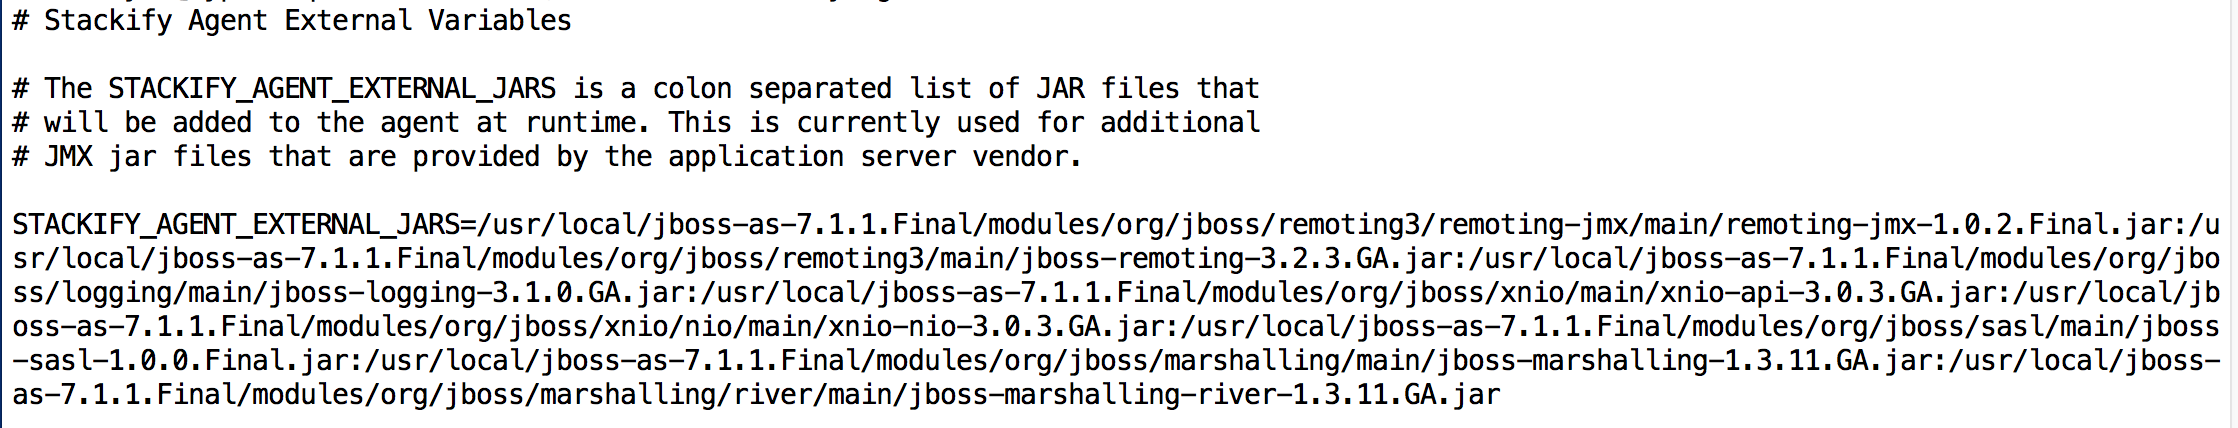
Sample Stackify Configuration File
Here is a sample of what the STACKIFY_AGENT_EXTERNAL_JARS= should look like.
MBean Smart Defaults
After the JMX connection is created and Stackify discovers a Web App, either through auto-discovery or manual configuration, Java MBeans are added by default to better monitor the JVM. MBeans that monitor the Classes, Threads, Memory and Garbage Collectors of the web app are added automatically using MBeans smart defaults. To learn how to add other non-default MBeans to customize monitoring of your App, see the section about App Monitoring in the App Dashboard Overview article.