- Welcome to Retrace
- Installing Retrace
- Account Setup
- Application Performance
- Centralized Logging
- Error Monitoring
- Monitoring Configuration
- Overview
- Application Monitoring Overview
- Application Monitoring Configuration
- Windows Performance Counters
- How to Monitor Key Transactions
- How to Monitor Your Logs
- How to Monitor Azure Service Bus
- Server Monitoring Templates
- How to Monitor SQL Queries
- How to Monitor Websites
- How to Monitor Files
- Log Query Monitor Best Practices
- Alerts and Notifications
- FAQs
- Deployment Tracking
- RUM Setup Guide
- OTel Support
- .NET Setup Guide
- Getting Started
- APM Setup Guides
- New vs Legacy Profiler
- Legacy .NET Profiler Guide
- Supported Technologies
- .NET APM on Windows
- .NET APM on Linux
- .NET APM with Docker (Linux)
- .NET APM with Kubernetes
- Custom Instrumentation
- APM Troubleshooting Guide
- Agent Installation Options
- How to Profile Windows Services
- Azure Deployments
- AWS Deployments
- Advanced APM Topics
- .NET Logging Guide
- .NET API Library
- Examples
- Java Setup Guide
- APM Setup Guides
- Java APM on Linux
- Java APM on Windows
- Java APM with Docker
- Java APM with Kubernetes
- Java APM with AWS ECS
- Java APM with AWS Fargate
- Java APM with AWS Lambda
- Java APM with Heroku
- Java APM Troubleshooting Guide
- Support for Java Background Services
- How to Collect Servlet Web Request Details
- Custom Instrumentation
- Supported Java Technologies
- Getting Started
- Logging Setup Guides
- Java API Library
- Examples
- APM Setup Guides
- PHP Setup Guide
- Getting Started with PHP
- APM Setup Guides
- PHP APM with Linux
- PHP APM with Docker
- PHP APM with Kubernetes
- PHP APM with AWS ECS
- PHP APM with AWS Fargate
- PHP APM with AWS Elastic Beanstalk
- PHP APM with AWS Lambda
- PHP APM with Plesk
- PHP APM with Heroku
- PHP APM Troubleshooting Guide
- Custom Instrumentation
- Advanced Configuration
- Supported PHP Technologies
- Logging Setup Guides
- Node.js Setup Guide
- Getting Started
- APM Setup Guides
- Node.js APM with Linux / Windows
- Node.js APM with Docker
- Node.js APM with Kubernetes
- Node.js APM with AWS ECS
- Node.js APM with AWS Fargate
- Node.js APM with AWS Lambda
- Node.js APM with AWS Elastic Beanstalk
- Node.js APM with Heroku
- Node.js APM Troubleshooting Guide
- Custom Instrumentation
- Supported Node.js Technologies
- Logging Setup Guides
- Ruby Setup Guide
- Getting Started
- APM Setup Guides
- Ruby APM with Linux / Windows
- Ruby APM with Docker
- Ruby APM with Kubernetes
- Ruby APM with Heroku
- Ruby APM with Scalingo
- Ruby APM with AWS ECS
- Ruby APM with AWS Fargate
- Ruby APM with AWS Lambda
- Ruby APM with AWS Elastic Beanstalk
- Ruby APM Troubleshooting
- Custom Instrumentation
- Advanced Configuration
- Supported Ruby Technologies
- Logging Setup Guides
- Python Setup Guide
- Integrations
- Prefix
- What is Prefix?
- Getting Started
- Updates In Prefix
- Distributed Tracing
- Missing Spans
- Search Syntax
- Open Telemetry Support
- Using Prefix with .NET
- Using Prefix with Java
- Using Prefix with PHP
- Using Prefix with Node.js
- Using Prefix with Ruby
- Using Prefix with Python
- Prefix Premium
- Troubleshooting
- Data Collection Policy
- Release Notes
- Windows Agent Release Notes 2024
- Linux Agent Release Notes 2024
- Profiler Updates 2024
- 2023
- 2022
- 2021
- 2020
- 2019
- December Platform Release
- Windows Agent 4.24
- November 19, 2019 - Platform
- October 15, 2019 - Platform
- Windows Agent 4.23
- September 19, 2019 - Platform
- Windows Agent 4.22
- August 27, 2019 - Platform
- August 1, 2019 - Platform
- Windows Agent 4.21
- July 11, 2019 - Platform
- July 1, 2019 - Platform
- Windows Agent 4.20
- June 4, 2019 - Platform
- Linux Agent 2.20
- May 15, 2019 - Platform
- April 16, 2019 - Platform
- April 2, 2019 - Platform
- March 19, 2019 - Platform
- Windows Agent 4.19
- March 11, 2019 - Platform
- Linux Agent 2.17
- February 6, 2019 - Platform
- January 17, 2019 - Platform
- January 8, 2019 - Platform
- Linux Agent 2.16
- 2018
- December 19, 2018 - Platform
- December 2018 - Platform
- November 2018 - Platform
- Linux Agent 2.15.5
- Windows Agent 4.18.8
- October 2018 - Platform
- Windows Agent 4.17.20
- Windows Agent 4.17.19
- Linux Agent 2.14.3
- September 2018 - Platform
- Windows Agent 4.17.14
- Windows Agent 4.17.11
- August 2018 - Platform
- July 2018 - Windows Agent 4.16
- July 2018 - Platform
- June 2018 - Platform
- April 2018 - Platform
- March 2018 - Platform
- March 2018 - Windows Agent 4.14
- March 2018 - Linux Agent 2.9
- February 2018 - Platform
- February 2018 - Windows Agent 4.13
- January 2018 - Windows Agent 4.12
- January 2018 - Windows Agent 4.11
- January 2018 - Linux Agent 2.8
- January 2018 - Linux Agent 2.6
- January 2018 - StackifyLib 2.1
- Other Announcements
- Insights
- Website Monitoring and Alerting
- Alert Notification and Escalation
- Leveraging Retrace for the Different Application Support Levels
- Application Cloud Migration and Re-architecture Journey
- Using Retrace as a key DevOps CI/CD automation tool
- ITIL v4 Service Management – Service Operations Processes
- Problem Management – Key to Achieving Operational Excellence
- OTel Appliance - Put your serverless and containerized apps on Retrace
- Open Telemetry: Under The Hood
Stackify's Errors and Logs API enables you to get more from what you're logging. Simply plug in a Stackify appender into your existing framework, or log your messages directly to Retrace without a framework via the Stackify API. Once properly configured, you will be able to get more contextual information about your exceptions, view your app's log messages, begin correlating exceptions with other problems, and even monitor error rates in your production applications to detect error spikes.
This article will give you an overview of what you can do in Retrace with the Errors and Log Dashboards after successfully configuring your project with Stackify's API. At the end of this article are links to configuration guides for our supported logging frameworks.
Errors Dashboard
From the Errors Dashboard, you can get an overview of all the exceptions of all your applications across different environments. It gives you a central location to view details about your errors.
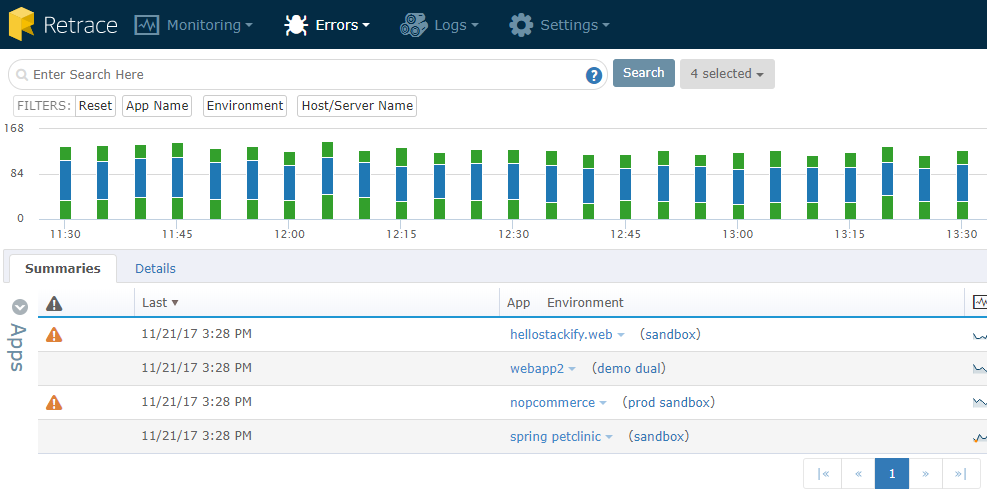
With Retrace's Errors service, you can:
- Get notified by email on new and regressed errors
- Perform searches and apply filters across all your errors
- See error trends across all apps and environments
To see more information on this, see the article titled Errors Dashboard.
Logs Dashboard
In the Logs Dashboard, you will be able to get an aggregation of all your logs from all your applications all within the same place.
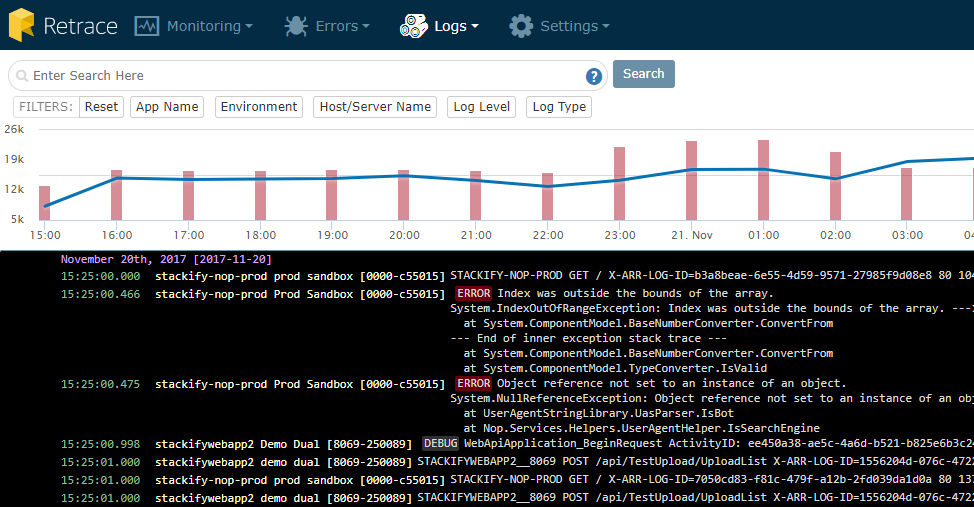
Using this Dashboard can help you view the contextual information needed to diagnose your errors. With Retrace's Logging Service, you can:
- Search across multiple servers, apps, & environments
- Visually see logs & errors and explore logging data
- Jump to any point in time to view aggregated logs
- Quickly identify errors in logs
To see more information on this, see the article titled Logs Dashboard.
Configuring Errors and Logs With Retrace
The Stackify API, which includes support for .NET, Java, PHP, Node.js, and Ruby based apps, can be found on our Github page. For all of the supported framework-specific setup and configuration instructions, follow the appropriate links below:
.NET
- Log4Net
- NLog
- Elmah
- Log directly to the .NET Stackify API (no framework)