This guide aims to enable Retrace APM monitoring on a sample .NET 6 MVC app on Windows. The app used in this example is based on the MVC template for .NET 6 and has logging events configured in some of the pages. Serilog (2.12) is primarily used as the logger, with StackifyLib (direct API logging) in some events.
- Home - Just a bare Home page that logs the following:
- Debug log
"#index - accessed"(Serilog) - Error log
"Test exception #test-plain"(StackifyLib Direct API)
- Debug log
- Privacy - page that logs a debug log
"#privacy - accessed" - Test - intermittently generates the following log events:
- Info log
"Nothing happened, really #nothing" - Error log
"An exception was #caught" - Info log
"App carries on, #finally" - Error log
"App raised an #uncaught exception"
- Info log
This guide will also walk through the steps of how to host the .NET application in IIS on Windows.
Set Up the Sample App
- Download the sample Dotnet app from https://github.com/stackify/example-apps ("sample-dotnet" folder) and deploy it on IIS* (or run it later as a self-hosted app). To deploy on IIS:
- Extract the folder "sample-dotnet" to C:\inetpub\wwwroot. At the end of this step, you should have all the sample web files in C:\inetpub\wwwroot\sample-dotnet\ (any folder name can be used here). In the succeeding screenshots, I have renamed this folder to "SampleApp", e.g. C:\inetpub\wwwroot\SampleApp.
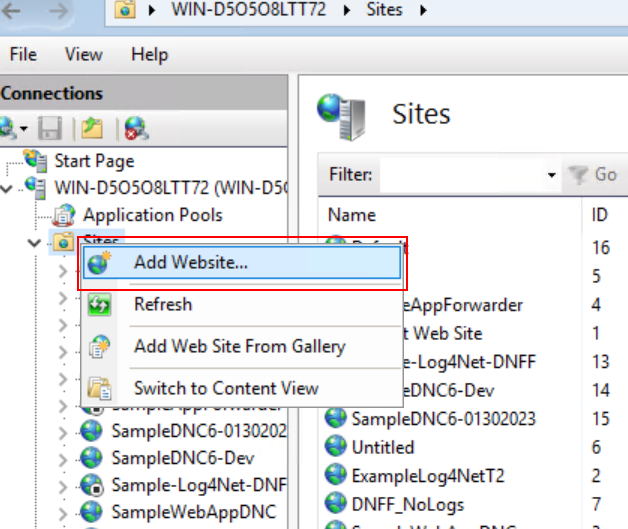
- Open up IIS Manager (search from start menu)
- Expand the current server until you see Application Pools and Sites
- Right-click on "Sites" and select "Add Website"
- Fill-in the details such as the site name, physical path (from step 1a), IP address ("all unassigned" can be used), and Port (make sure it is not the same with an existing site).
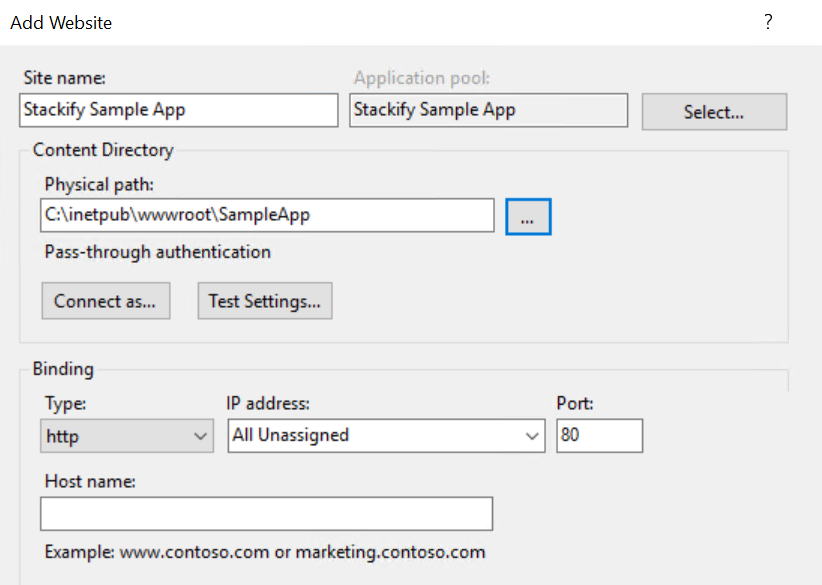
The image above uses port 80, however, there may already be an existing site in your IIS environment that uses this port. To check, browse http://localhost:80 in your web browser and see if a site loads. If it's already in use, try another port such as 81. You can do the same check by substituting 80 above with the port number you intend to use.
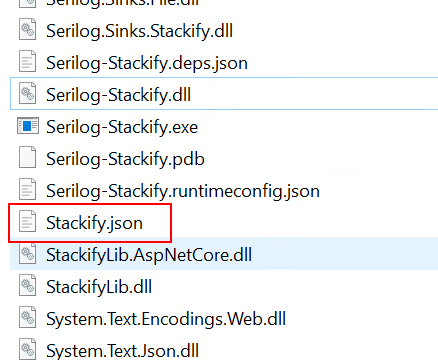
- Open the
Stackify.jsonfile bundled with the app. Adjust the app and environment properties as required. These names are mainly used to identify the app in Retrace.
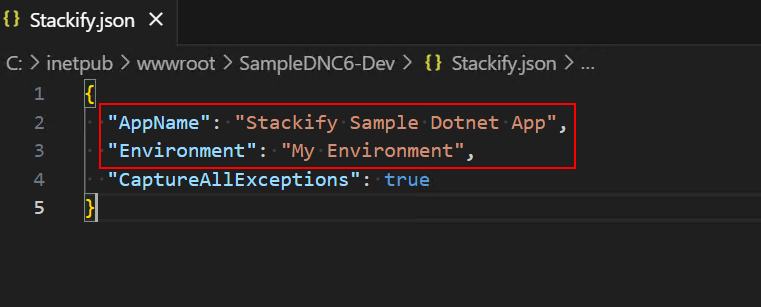
{
  "AppName": "Stackify Sample Dotnet App",
  "Environment": "My Environment",
  "CaptureAllExceptions": true
}
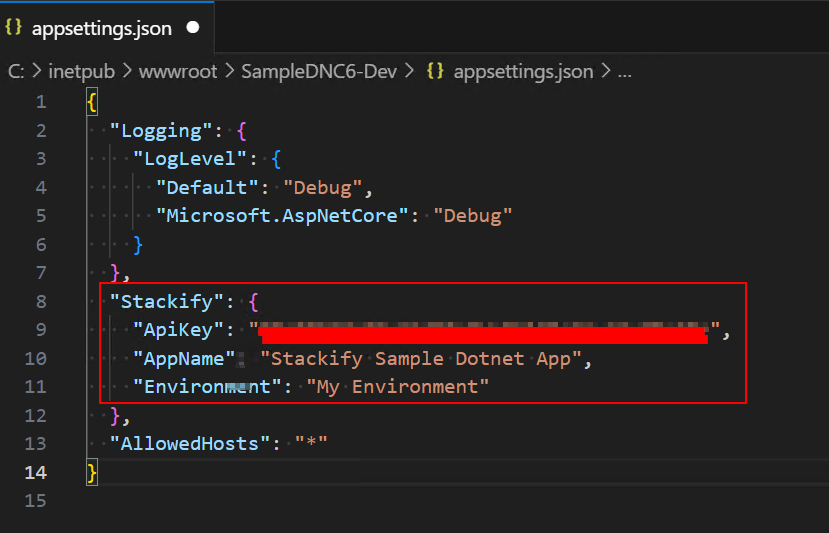
- Open the
appsettings.jsonfile of the app. The Stackify properties in this config file are for logging integration with Retrace. Supply your API key under the Stackify.ApiKey property. It’s important that the application and environment names match those from the Stackify.json file in order to correctly match logs with an app entry back in your Retrace account.
{
  ...
  "Stackify": {
    "ApiKey": "Your-API-Key-Here",
    "AppName": "Stackify Sample Dotnet App",
    "Environment": "My Environment"
  }
  ...
}
Forgot your API key? Visit this link on your account to get the key.
- Run the app on IIS, or launch the app's executable. You should see a similar page below when you visit the Test page of the app at http://localhost/Test, for example:
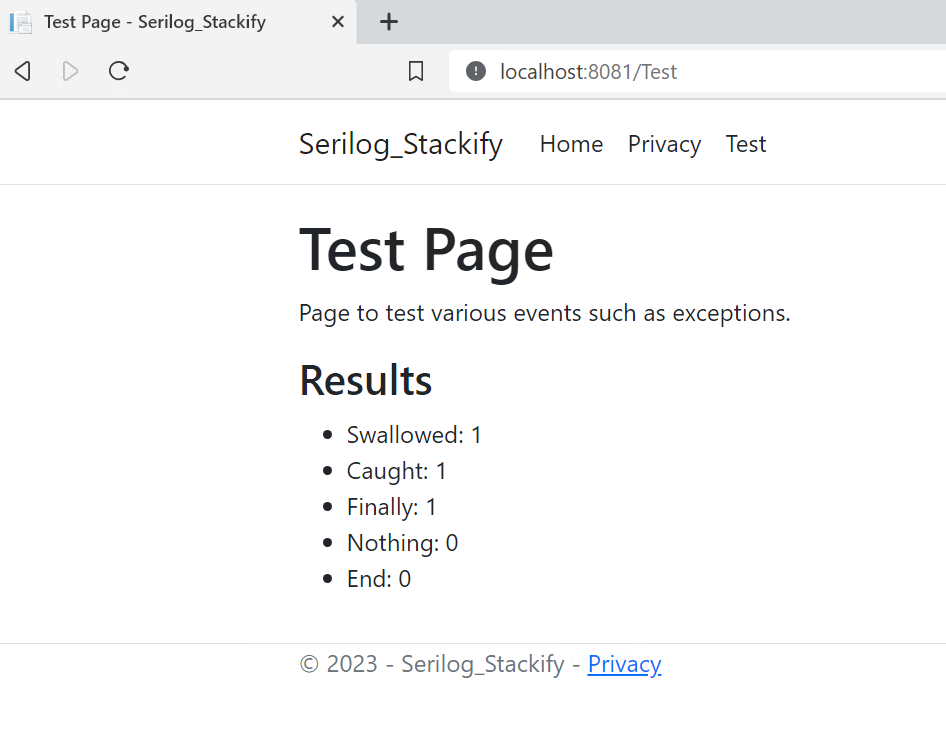
The image above shows http://localhost:8081/Test -- your setup could be different so make sure you specify the actual port configured back in step 1e. If you run the app's main executable instead of hosting it in IIS, then it will run on port 5000 by default, e.g. http://localhost:5000/Test.
The sample app requires .NET 6 hosting runtime installed on the machine.
Install Retrace
- Download the latest version of the Stackify (Retrace) agent from: https://s1.stackify.com/Account/AgentDownload/Index
- Start the installer.
2.1 The installer will check and install (if missing) .NET Framework 4.6.2 and Visual C++ 2013/2017 libraries. A system restart may be required if .NET Framework 4.6.2 has to be installed.
2.2 Supply your Retrace API Key
2.3 Options: Java profiling - if you plan to instrument Java apps; Legacy profiler - if you want to monitor apps that have outdated .NET runtime targets;
2.4 Automatic IIS Restart - auto-restart IIS (and its worker processes) after the agent is installed.
Restarting IIS worker processes is important to get the profiler attached, so either you restart IIS after the installation or restart it manually at a later time.
- The server where the agent is installed should appear in your Retrace account after the installation.
Post-installation checks
The following environment variables should be automatically registered after installing the agent:
COR_ENABLE_PROFILING=1
COR_PROFILER={cf0d821e-299b-5307-a3d8-b283c03916da}
CORECLR_ENABLE_PROFILING=1
CORECLR_PROFILER={cf0d821e-299b-5307-a3d8-b283c03916da}
StackifyPath=C:\Program Files (x86)\Stackify
There are cases when IIS does not pick these up even after restarting the service, so a server restart may be required.
Restart IIS
If you enabled the IIS Restart option during installation, or had to restart the server, then you may skip this step.
You can restart IIS by either executing iisreset in an elevated terminal, or via IIS Manager.
Send requests to your application
When the app receives requests, the profiler immediately goes into action. You can check the following paths below after sending 1-2 requests:
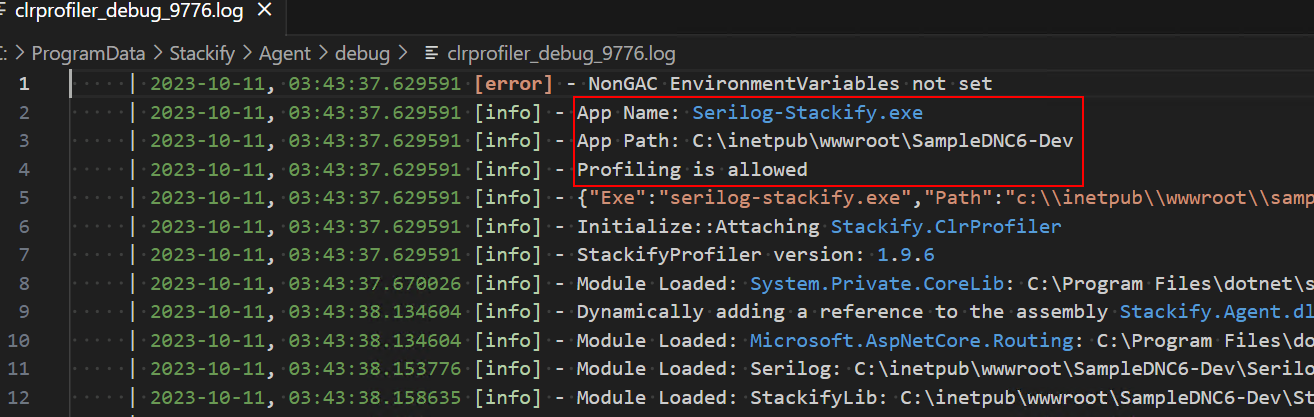
-
C:\ProgramData\Stackify\Agent\debug\- this is where profiler debug logs are generated. The debug logs are namedclrprofiler_debug_*.logand will reflect the app's main assembly or executable. The file will also indicate whether profiling is allowed or not.
-
C:\ProgramData\Stackify\Agent\log\- if everything works, you should see trace logs generated in this path. The Retrace agent reads the traces here and uploads them to our platform.
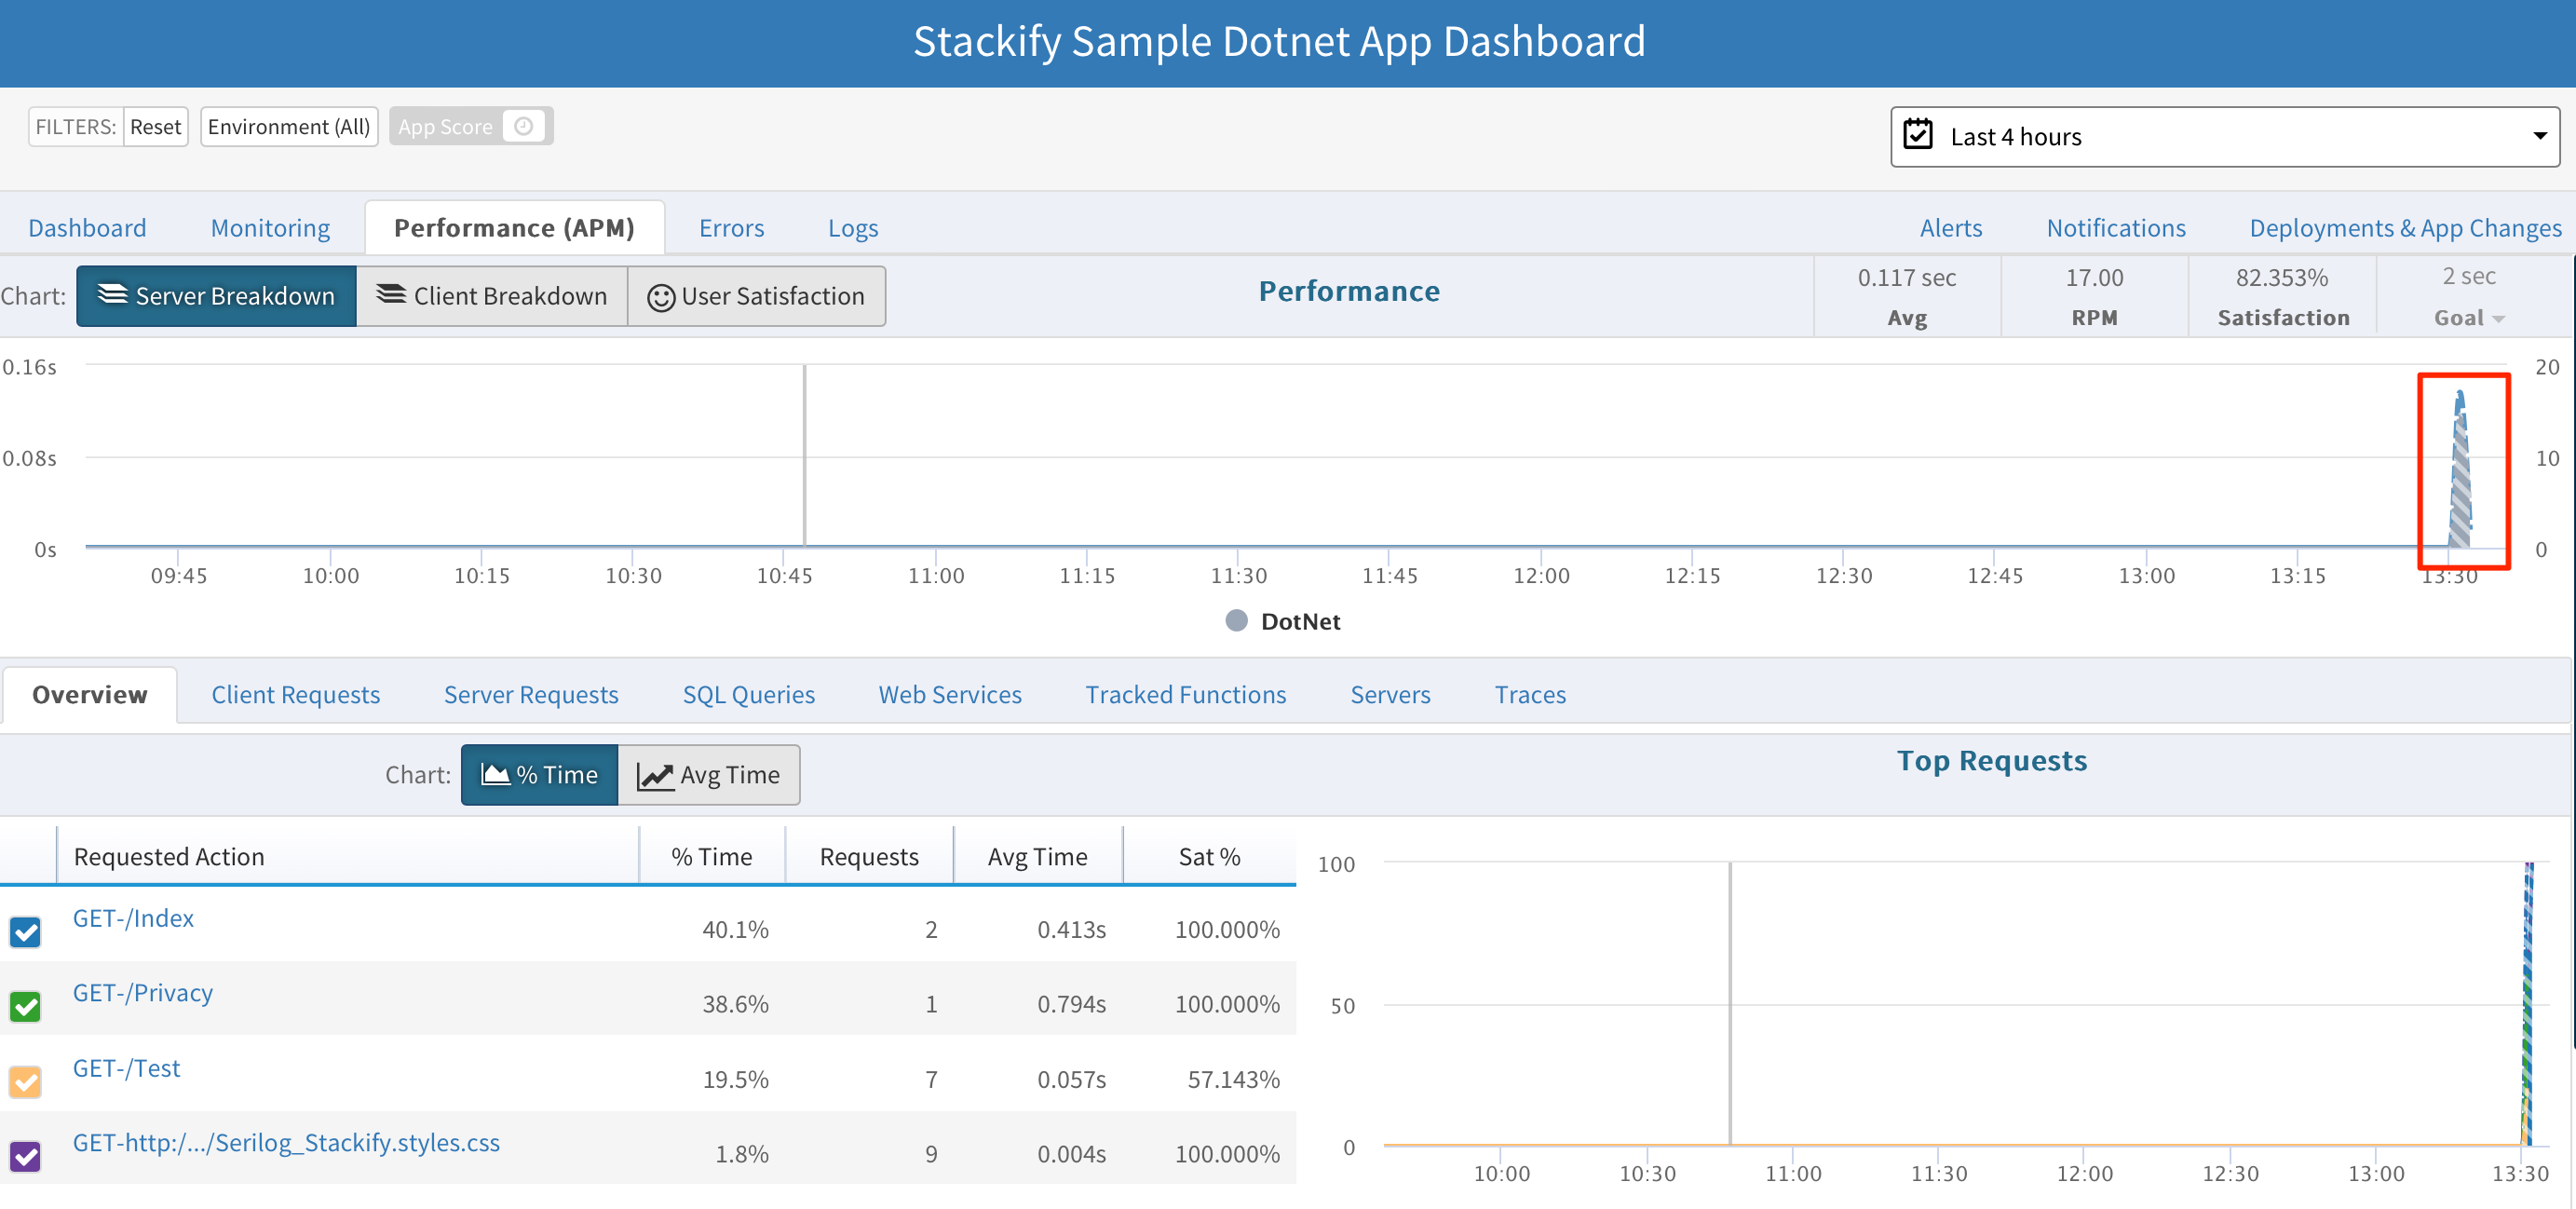
See APM data reflected on Retrace.
On average, APM initially shows up around 15 minutes after confirming that traces have been generated. Succeeding data should be reported within 2-5 minutes.
Logs will appear on the logs viewer. Errors/exceptions are considered as logs, but these also have a dedicated view under the "Errors" tab.
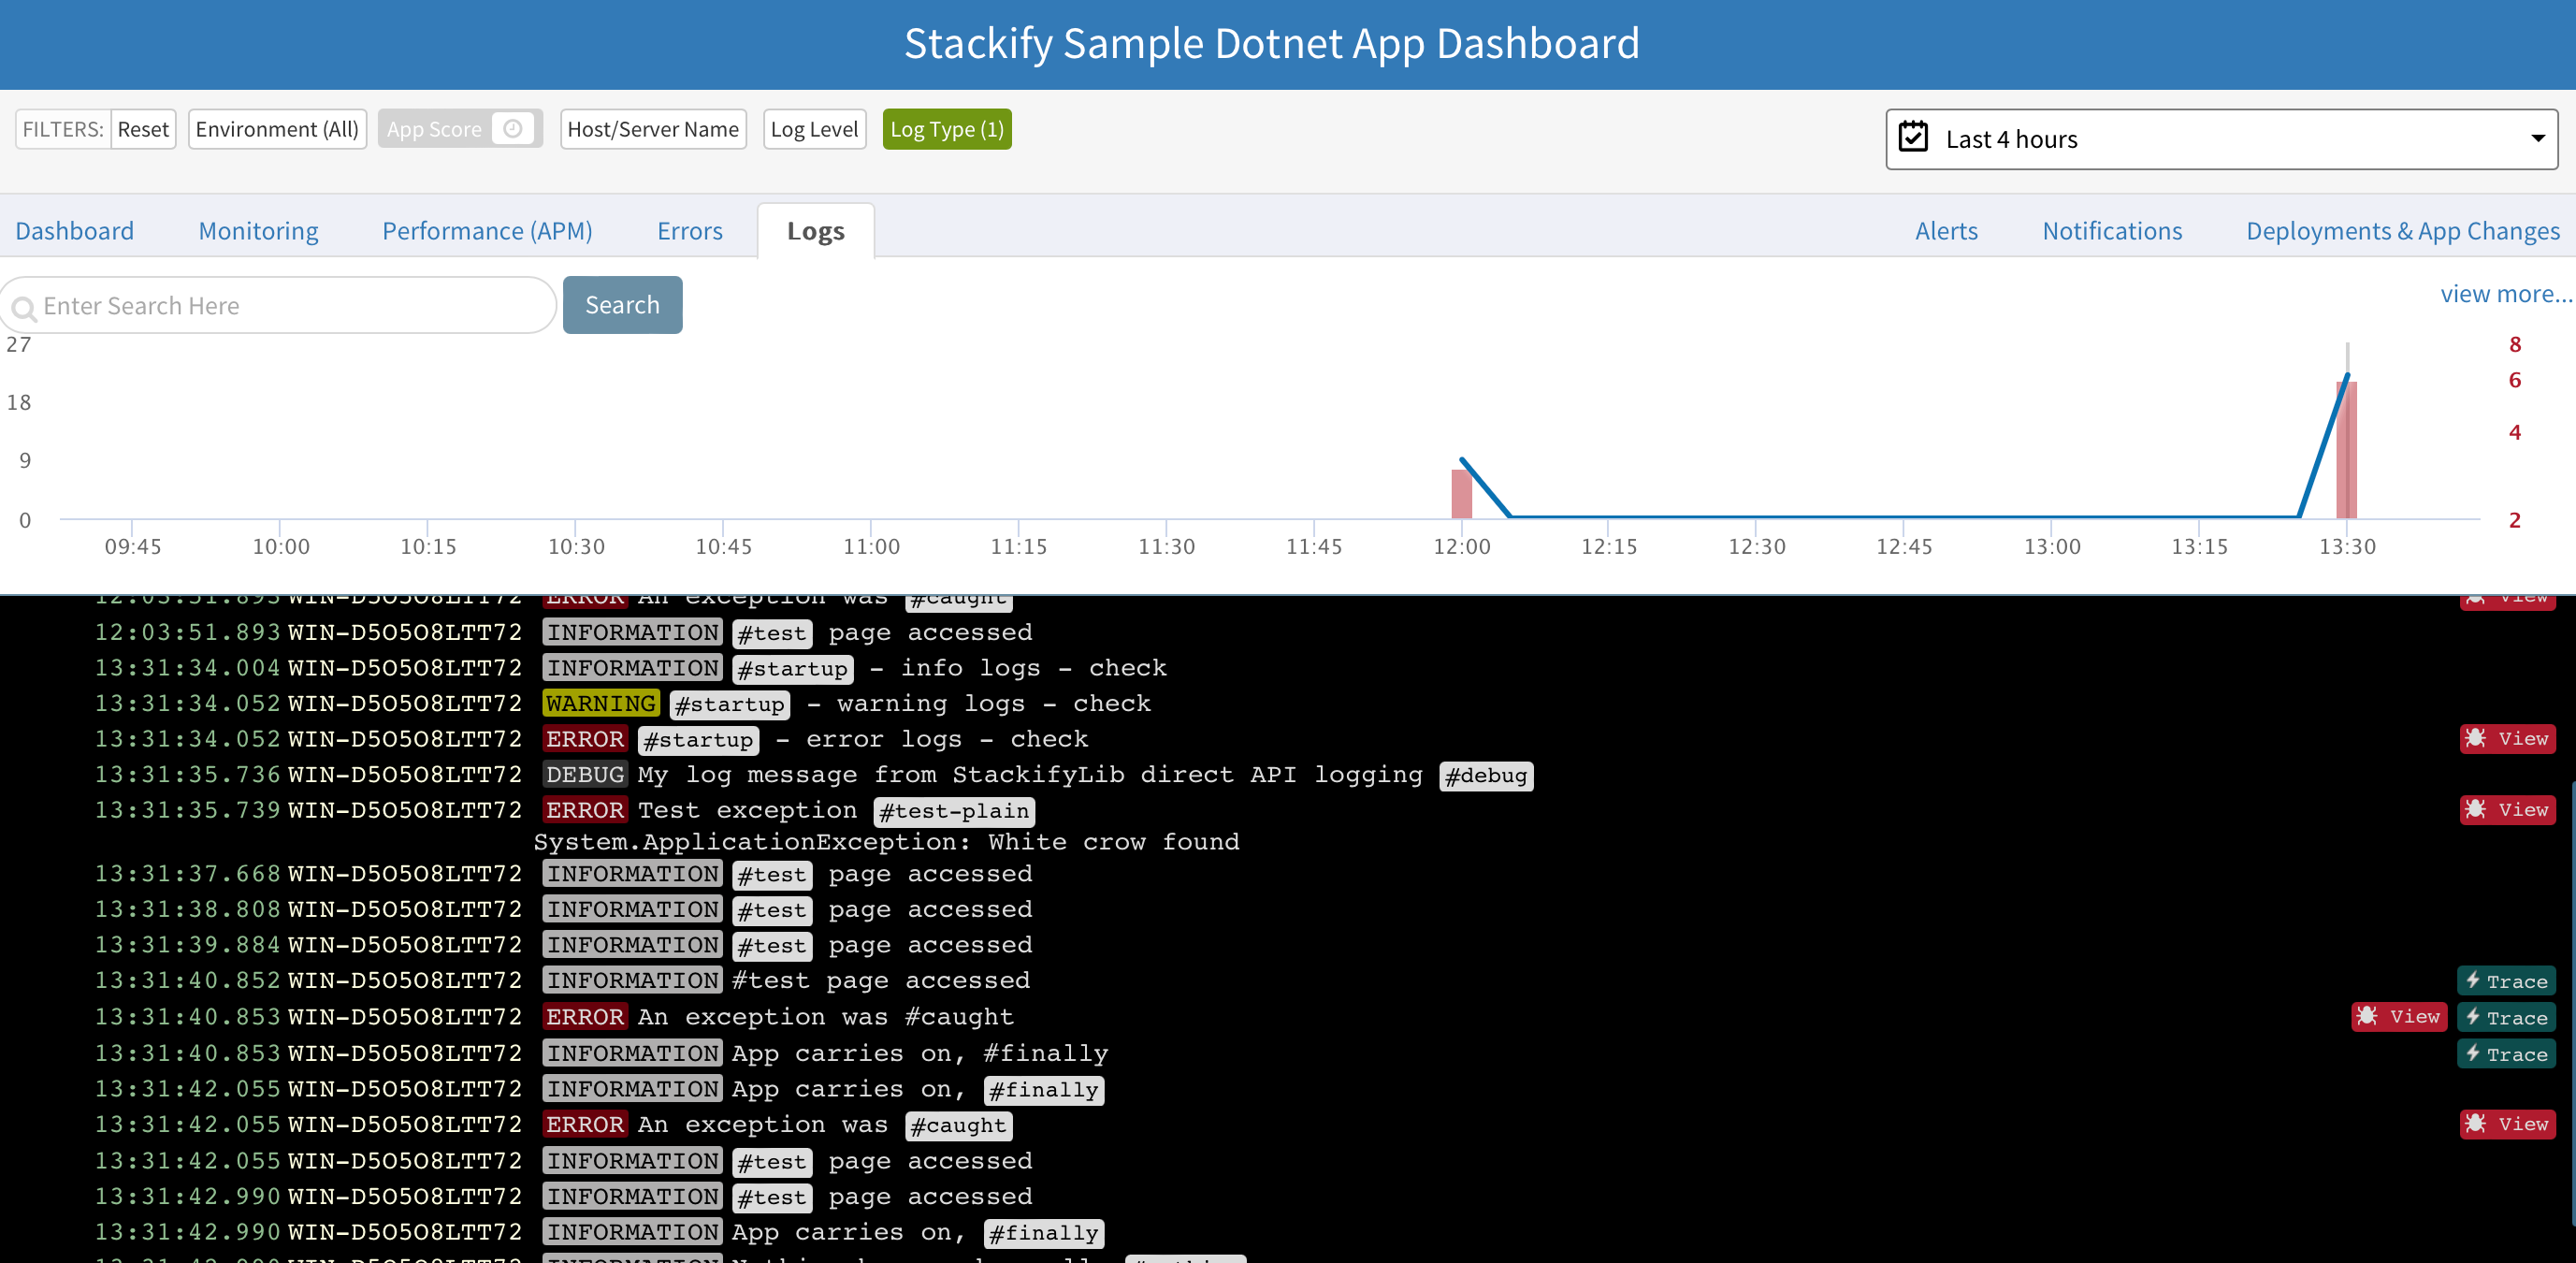
To learn more about viewing your application's data, be sure to check out documentation on the App Dashboard.