Retrace’s errors and logs widgets provide information that helps DevOps and Support Engineers understand the root cause of an issue. These narrowly-focused widgets fast track failure analysis thus serves as a cornerstone in troubleshooting application issues as soon as it occurs.
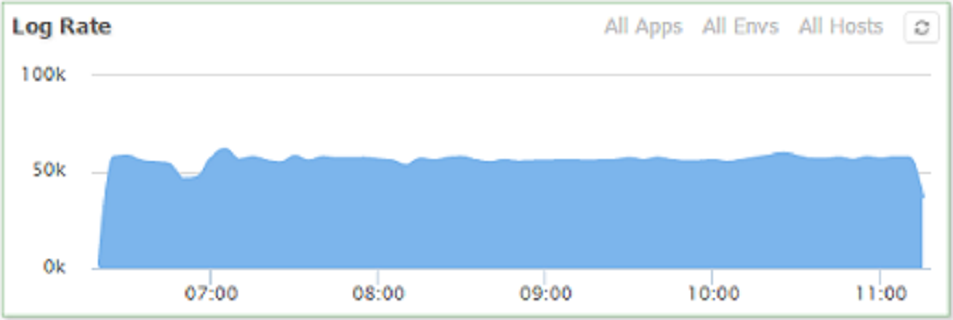
Logging rate
Monitor the volume of logs at any particular timestamp and easily see outages by checking for a lack of data. This widget also shows if there is a sudden spike of log volume which indicates a problem with the application’s performance.

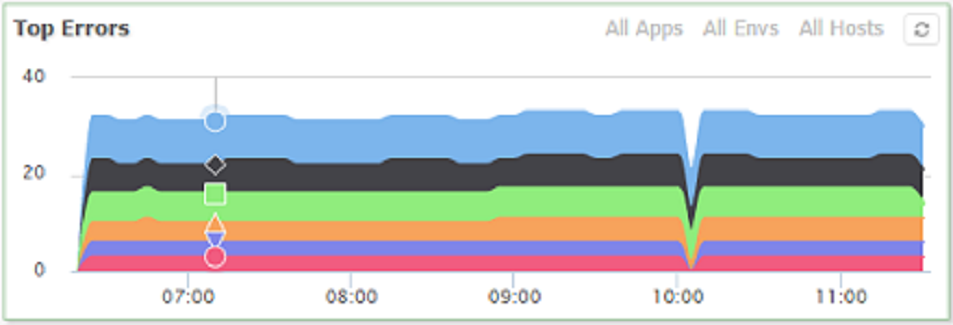
Top errors
Simply see the top five errors encountered by your application along with the error description and how often it occurred. Review the time of occurrence to address performance issues that are caused by these errors.

Recent Errors
Get top-level visibility of errors in terms of its occurrence. The latest information about errors in this widget gives you the exact place to start troubleshooting.

Top Error Chart
Get insights on the volume of errors at a specified time.

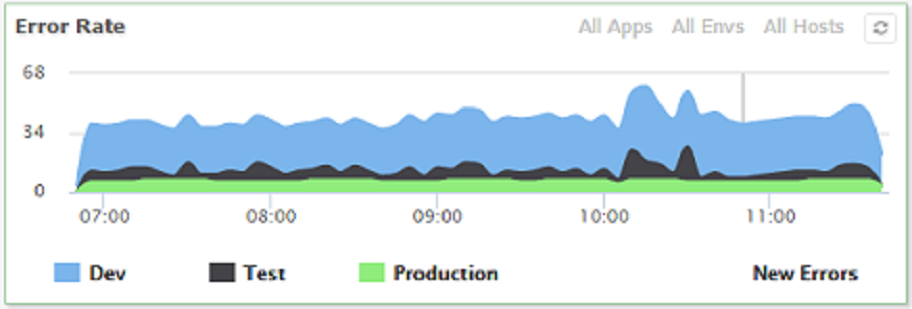
Error Rate
Establish the correlation between the volume of errors compared to a specified time. This report showcases all the errors for all applications running inside a particular environment.

Complex applications have many different components. This chart provides effective error and logs presentation that is relevant to the health of your application. Use these Errors and Logs widgets to correlate data and easily pinpoint issues.