The Errors Dashboard is meant to be a dashboard that will give you more insights to errors that are occurring in your applications. Here you will start getting more contextual information about your exceptions, begin correlating exceptions with other problems, and even monitor error rates in your production applications to detect error spikes.
If you have not already added the Stackify Errors and Logs API or a Stackify appender to your logging framework ( ex: Log4net, NLog, Elmah, Log4J or Logback) click here to get started sending your logs and errors to Stackify to take advantage of the features below.
Errors Dashboard
From the Error Dashboard, you can get an overview of all the exceptions of your applications across different environments. You can see an overall summary of your exceptions or you can change to a detailed view to see the log statements for the errors. 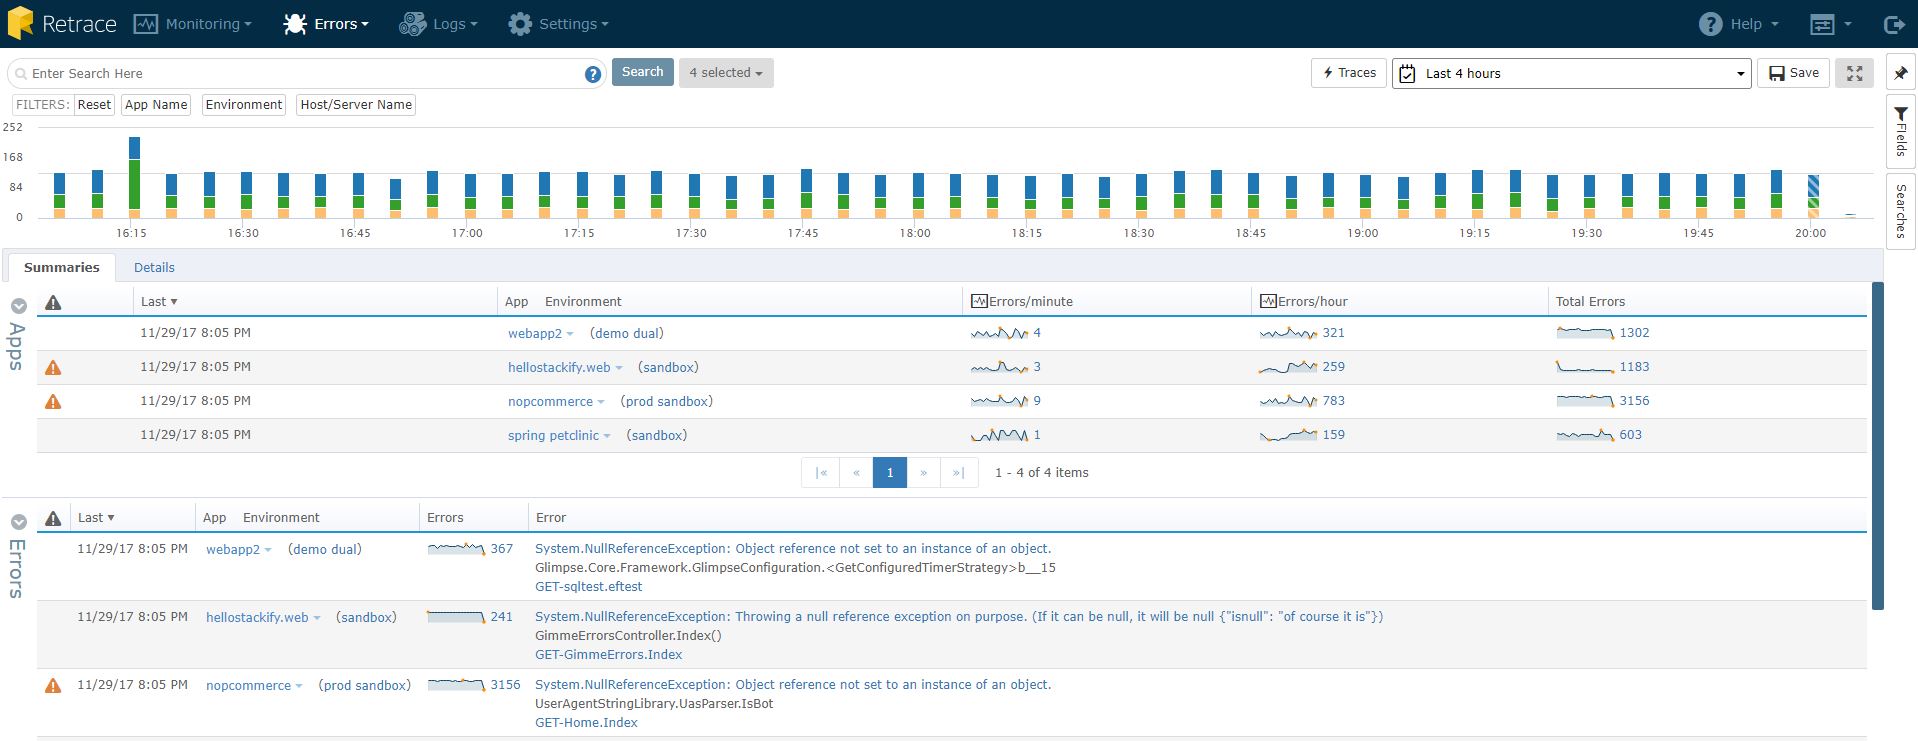
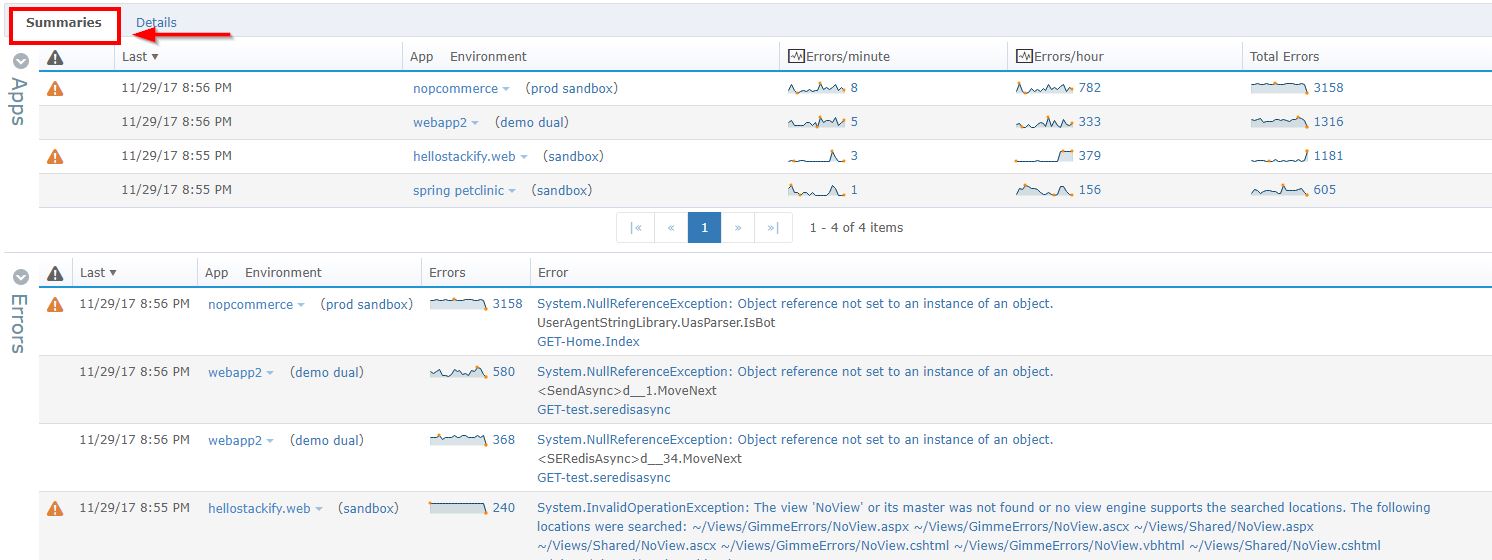
Summaries View
The Summaries Tab will give you an overview of the types of errors you are seeing. Stackify de-duplicates errors, so you see individual error instances with a count of occurrences, rather than all errors listed individually. This kind of view lets you see make sense of error history more effectively than a log-like view of errors.
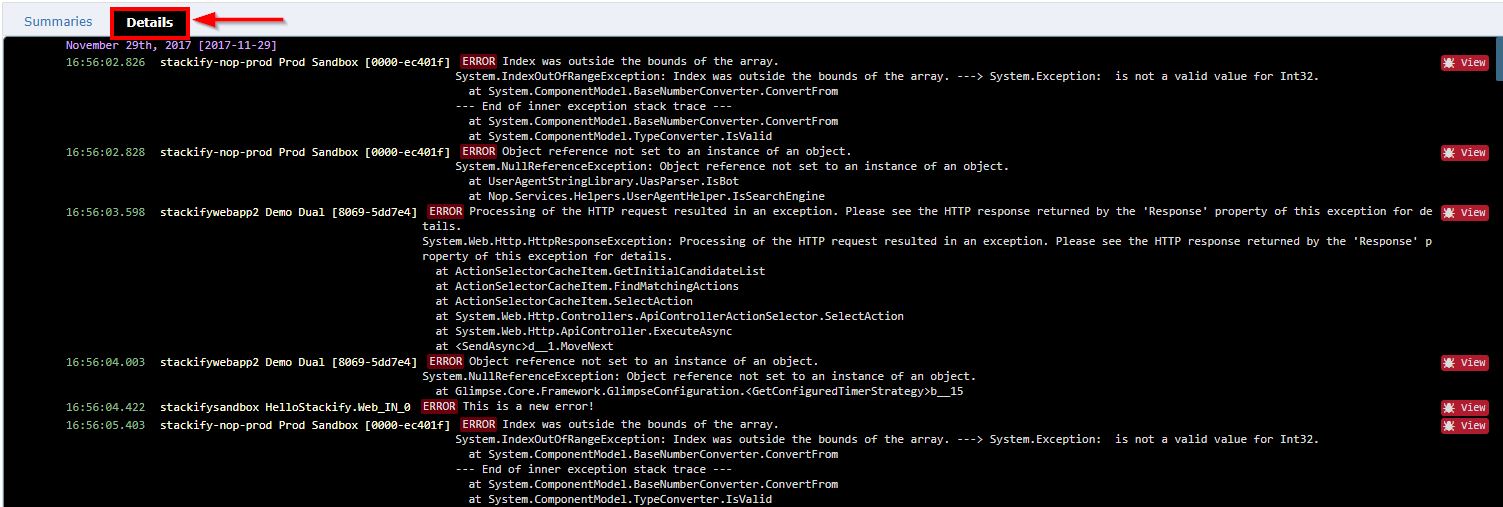
Details View
The Details view lets you see errors in the order they occurred. This particular view gives you a sense of the order of events, helping you correlate sequences effectively.
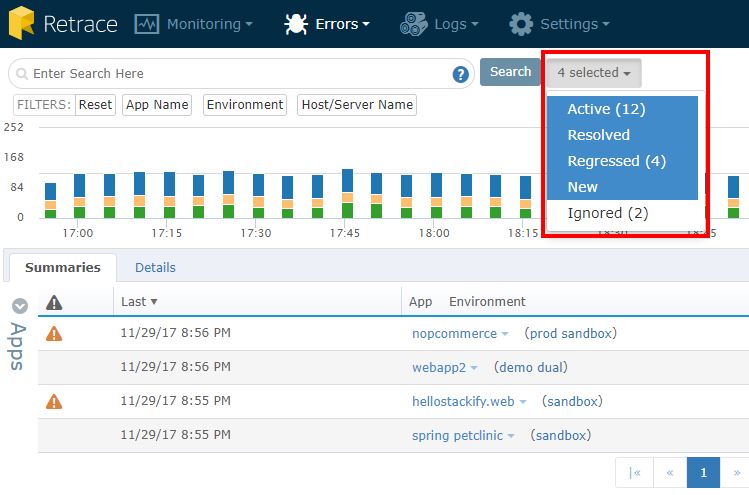
View Errors by Type
Isolate the type of errors by selecting the categories you want to view. Errors will be categorized by "Active", "Resolved", "Regressed", and "New". By default all 4 types will be selected, so click on a filter type in the drop down box to remove it from the Errors Details list.
- Active: Errors that are current that have not regressed or been resolved
- Resolved: Errors that have been marked as "Resolved" (see Error Details)
- Regressed: A "Resolved" error that has reoccurred
- New: Any error that has appeared for the first time in the time range searched.
- Ignored: Errors that the user has chosen not to display.
Applying Filters and Fields
Apply fields and filters to narrow down what errors you are searching for. This can be helpful when trying to investigate a certain error for a specific application in a specific environment. By using fields and filters to remove irrelevant errors, finding useful information becomes easier. You can see more information on this capability in the Filter and Fields document.
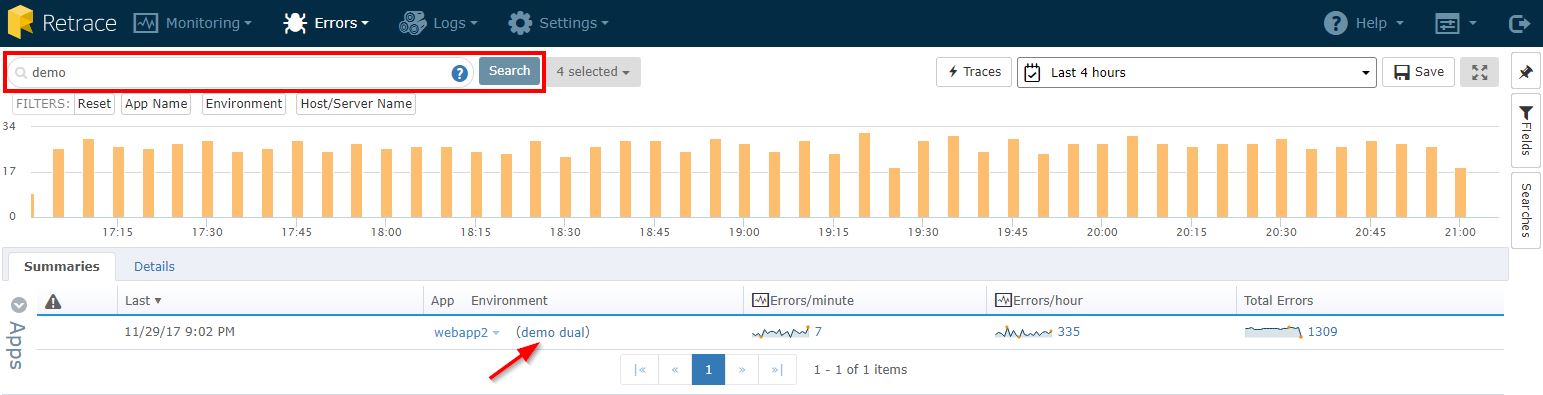
Searching for Errors
You can perform searches for queries in the search box. You will find results listed in both the Error stack traces in the Summaries View as well as results in the Details view.
Apps
The Error Dashboard is broken up in to two sections: Apps and Errors. In the Apps section, you will find a link to the App dashboard for each app, as well as error rates for each app broken down by environment. 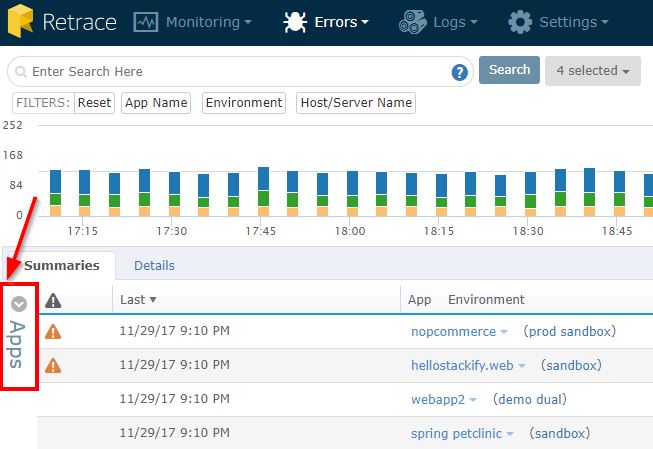
Viewing the App Dashboard
Clicking on the App link will take you to the App Dashboard. The App Dashboard will give you more information specific to that App. If you have multiple apps and are wanting to filter the results by an individual app, you can do so by selecting the option in the drop down of the app.
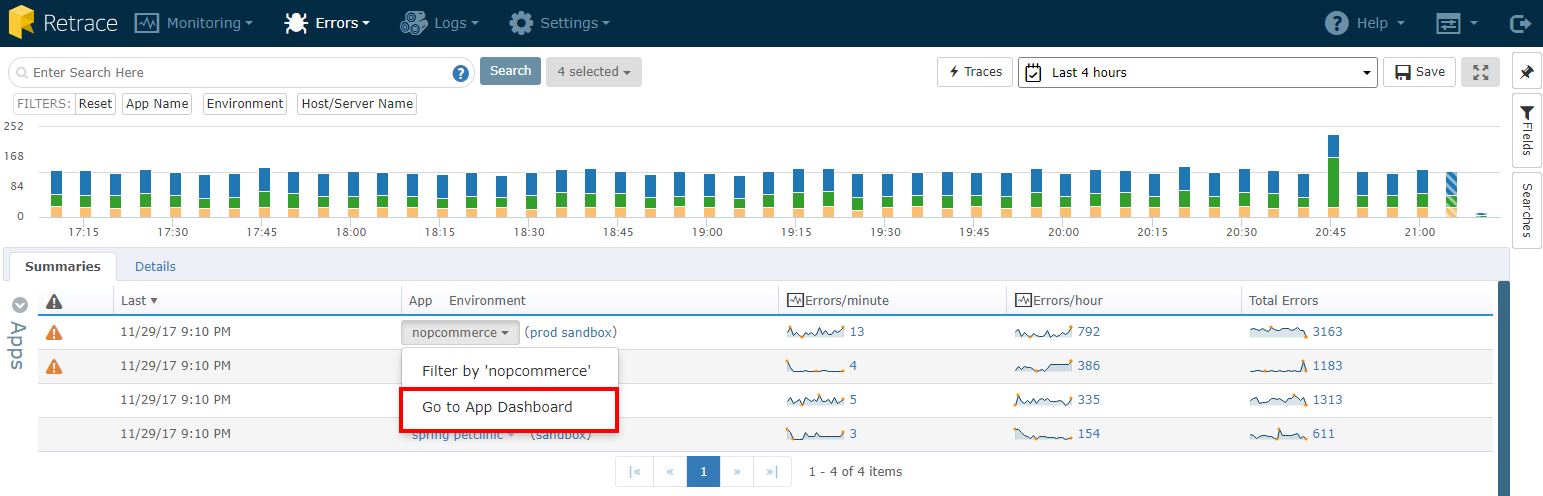
See Error Rates Per App
You can view error rates per minute or per hour. By clicking the number to the right of the trend line, you will be able to see a graph of errors for a given app over a specified time range.
Errors
In the Errors section you will see list of all errors occurring across all your Apps and environments sorted by the most recent errors. You can change the sorting by clicking on each column heading.
By clicking on the number of errors, you will be brought to a new page called Error Details so you can view some contextual information about an error.
Error Details
In the Error details page you will see the error's stack trace, location, time stamp, and other important information for all occurrences of the particular errors you are looking at. To learn more about how the Error Details page can help you identify problems with your app, view the Error Details article.
By clicking on the error message, you will be able to see the individual error details. This will give you additional information to help you investigate an error.
View Logs in Context
Many times it can be helpful to see the error in context with the rest of your logging messages to see the trail of what was happening leading up to the error. You can load more messages or click "view more..." to open the Log Dashboard.
View URI Performance
Here you can view a summary of the performance for each individual resource in your App. You will be able to view graphs related to performance, such as requests by satisfaction, error rates, and much more. You will also be able to view a list of the errors associated with the individual resource.
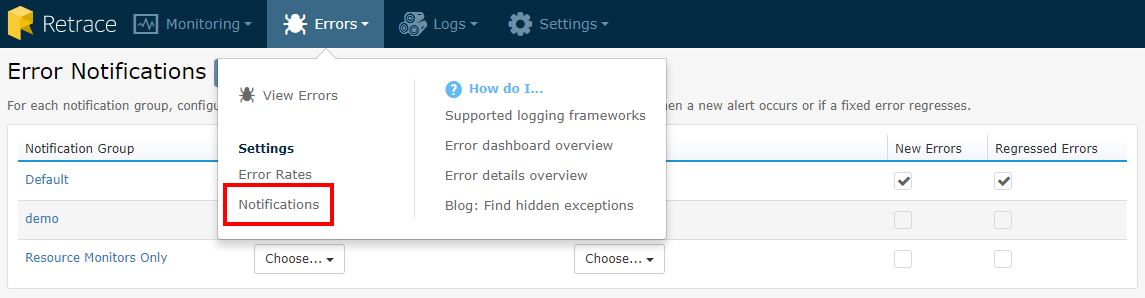
Notifications Tab
In the Errors Dashboard, you can set up Notification Groups to receive email or SMS notifications for new errors and regressed errors. To add a Notification Group, simply click the "Add New" button above. To find more information on Notification Groups, go to the article Setting Up Notification Groups.
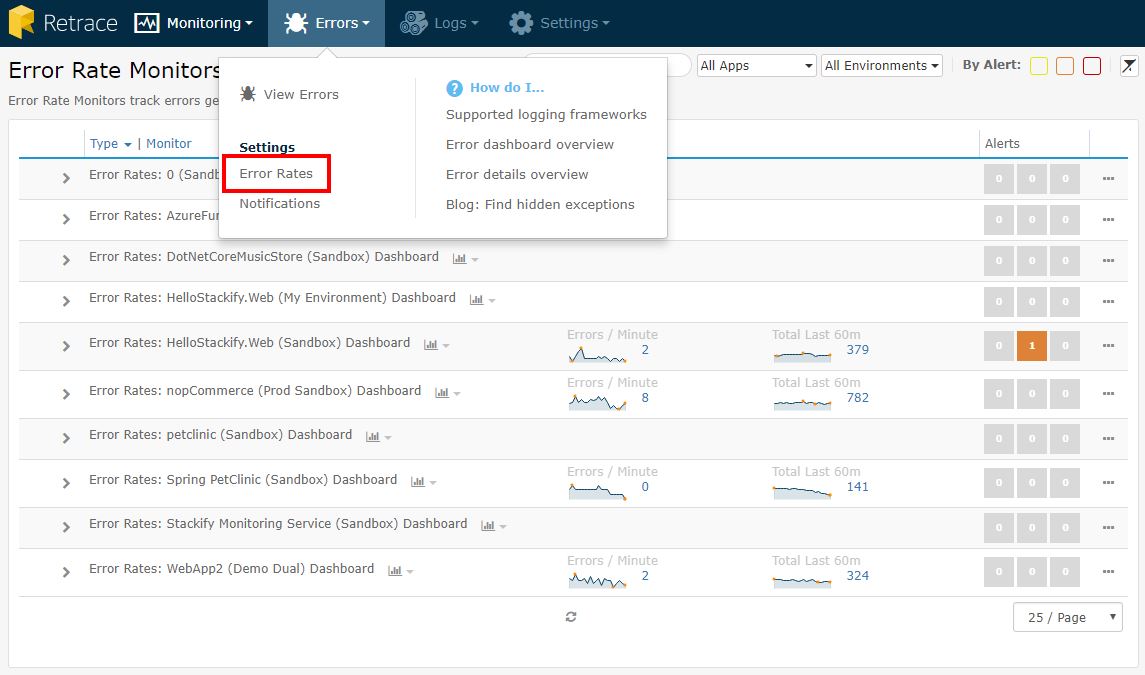
Error Rate Monitors
You can view Error Rate monitors and set up alerts directly from the Errors Dashboard. To configure the monitors and add thresholds, click the App name link and you will be brought to the App Monitor Configuration screen. To view more on configuring monitors at an App level, view the article on Configuring App Monitors.
Configuring Errors and Logging With Stackify
For framework-specific setup and configuration instructions, follow the appropriate link below to begin aggregating your Errors and Logs to Stackify: