This guide helps you monitor the number of log statements recorded over the past 24 hours and calculate your usage from it . It gives you the flexibility to create Log Query Monitors. Also, it provides alerts in case your usage reached its defined threshold.
Step 1 - Set up the query
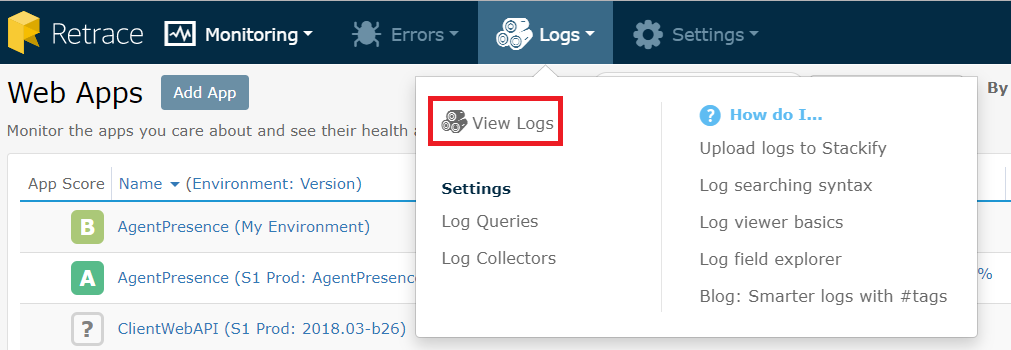
Click on the Logs tab and click on the View Logs link.
Set the time frame to Last Day, and click Save.

Step 2 - Save the search
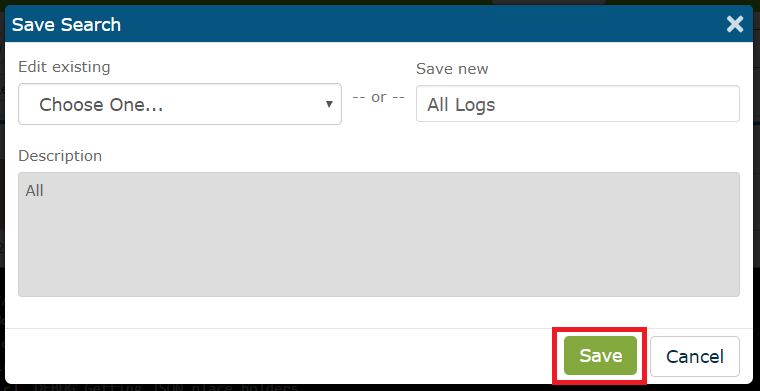
In the Save Search dialog box, under Save new, you can enter a name to search. In this case, "All Logs" is used but you are free to create whatever you prefer.
Step 3 - Verify log search is saved
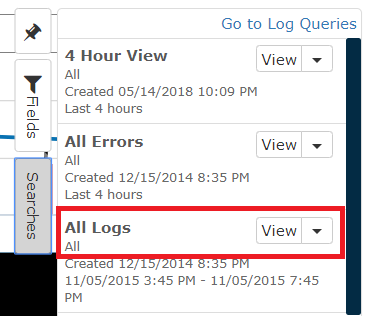
Click on the Searches tab on the sidebar. It will list the current saved searches in your account.
Step 4 - Create the log query monitor
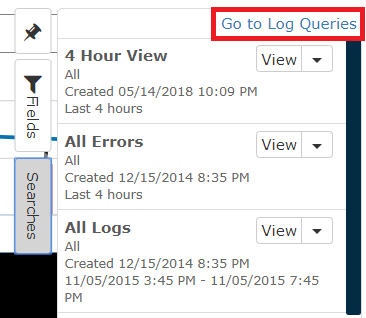
Click Go to Log Queries to visit the Log Query Monitors page.
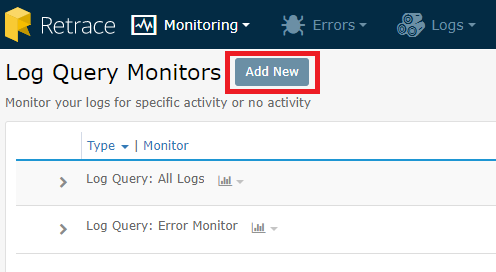
Click on the Add New button.
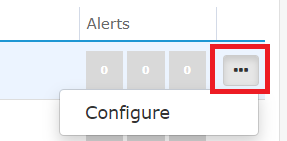
Once a new log query monitor is created, you can configure its properties by clicking the highlighted icon on its left side and click on the Configure link.
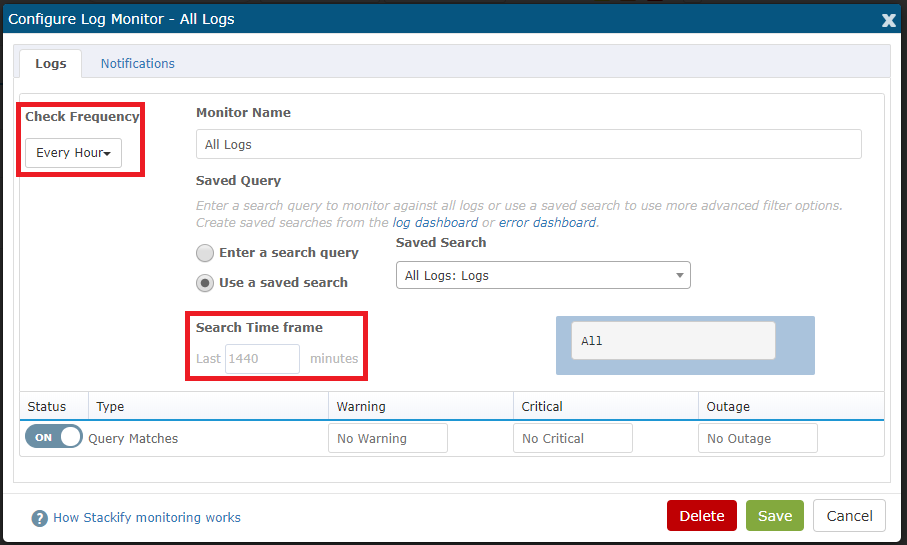
To configure, here are the critical properties:
- Check Frequency - Every Hour is a reasonable frequency, but you can change it according to your preference.
- Search Time Frame - Set this to 1440 minutes (24 hours). It will ensure that the monitor aggregates data for the last 24 hours.
Step 5 - See the results
Now that you have a working log monitor, you can view the record count on the Log Query Monitors screen. You can keep tabs on the number of results, add alert & notification thresholds so you can be alerted when there are an excessive number of log statements, and you can get an estimate of the amount of storage your log statements used.
