This guide is meant to walk through how to install the OTel appliance and configure the official OpenTelemetry Demo with Docker running locally on a Windows machine.
Although specific configuration will vary per environment (eg setting up configuration in an AWS cloud environment will differ from an Azure Cloud environment), the main overall steps are similar:
- Install the Retrace appliance in a container
- Instrument/Configure your application to send data to…
- your collector and then to the Retrace appliance, OR
- the appliance directly
Below is an example of configuring the Retrace OTel Appliance to run in a container of a self-managed version of Docker (Docker Desktop) with OpenTelemetry’s official demo application running in that same container.
Pre Reqs
- Install Docker Desktop
- Clone the OTel Sample App
git clone https://github.com/netreo/opentelemetry-demo.git
Step 1: Run the Demo App
Follow the guide at https://opentelemetry.io/docs/demo/docker-deployment/#get-and-run-the-demo to get the demo app up and running locally
Step 2: Pull down the docker image of the OTel Appliance
Pull down the Retrace OTel docker image from Docker Hub:
docker pull stackify/retrace-otel-agent
Step 3: Update the docker-compose file
Add the following to your existing docker-compose.yml file under the services: section:
services:
  retrace-otel-appliance:
      image: stackify/retrace-otel-agent:latest
      container_name: retrace-otel-appliance
      environment:
        - RETRACE__ACTIVATIONKEY=**YOUR_RETRACE_ACTIVATION_KEY**
        - RETRACE__ENVIRONMENTNAME="**YOUR RETRACE ENVIRONMENT NAME**"
      ports:
        # OTLPHTTP Protocol
        - "4080:80" # standard
        # OTLP Protocol (gRPC)
        - "4443:443" # standard
        # local admin port
        - "5001:80"   # localhost:5001 to localhost:80 (container port)
Add your Retrace Activation Key and Retrace Environment Name. The Retrace Activation Key can be found here: Retrace Activation Key
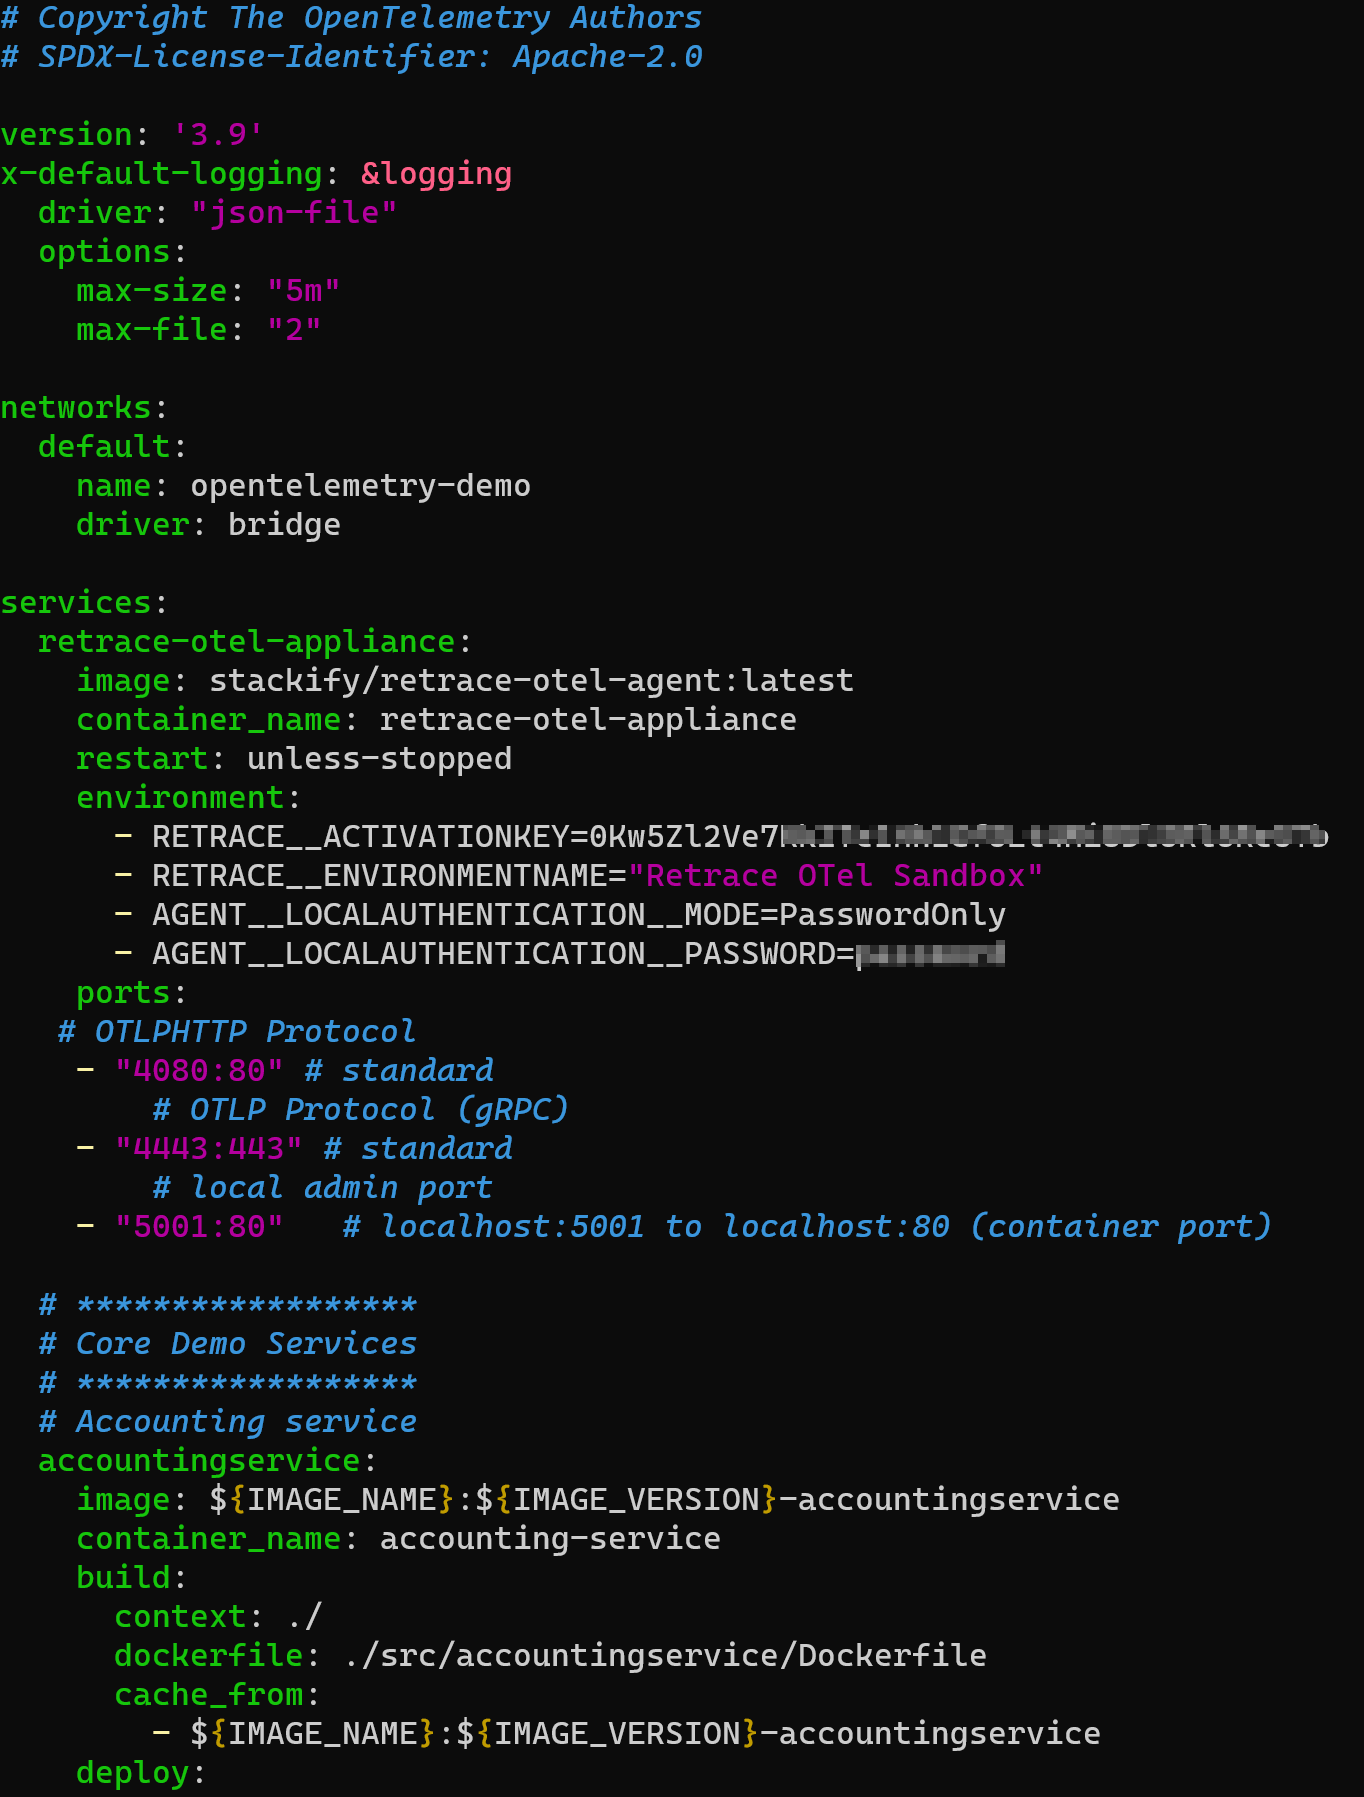
Below is an example of what the docker-compose.yml file could look like with the OTel appliance configuration added:
Step 4: Add the Appliance as an exporter
In the opentelemetry-demo/src/otelcollector/otelcol-config.yml file, make the following changes to add the Retrace Appliance as a collector for the traces and logs pipelines:
exporters:
    otlphttp/retrace:
        endpoint: "http://retrace-otel-appliance:80"
        tls:
            insecure: true
            insecure_skip_verify: true

service:
	pipelines:
         traces:
           exporters:
	        - otlphttp/retrace
         logs:
            exporters:
	         - otlphttp/retrace
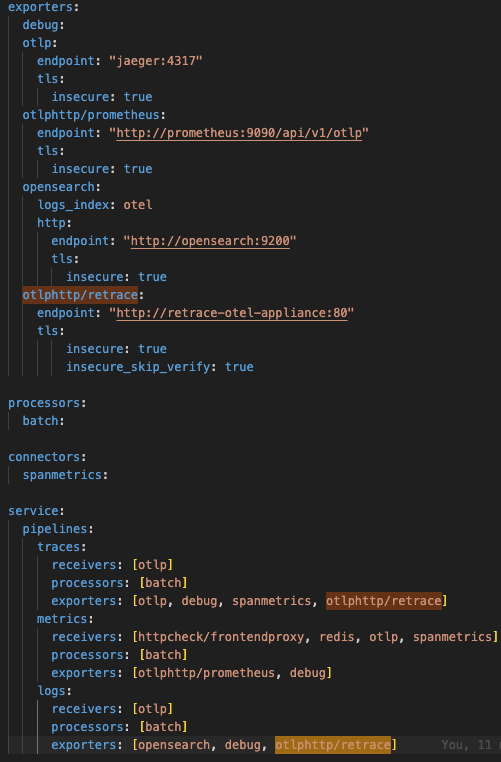
There are multipe ways to set the exporters for the traces and logs pipeline. See below for an example otelcol-config.yml file.
Step 5: Run the docker compose up command
docker compose up -d
This will apply the configuration changes made in steps 3 and 4 and run the demo application
Step 6: View the Demo Application
For this application, here are the observability services configured:
- Web store: http://localhost:8080/
- Grafana: http://localhost:8080/grafana/
- Feature Flags UI: http://localhost:8080/feature/
- Load Generator UI: http://localhost:8080/loadgen/
- Jaeger UI: http://localhost:8080/jaeger/ui/
- OTel Retrace Appliance Dashboard (for troubleshooting): http://localhost:5001/
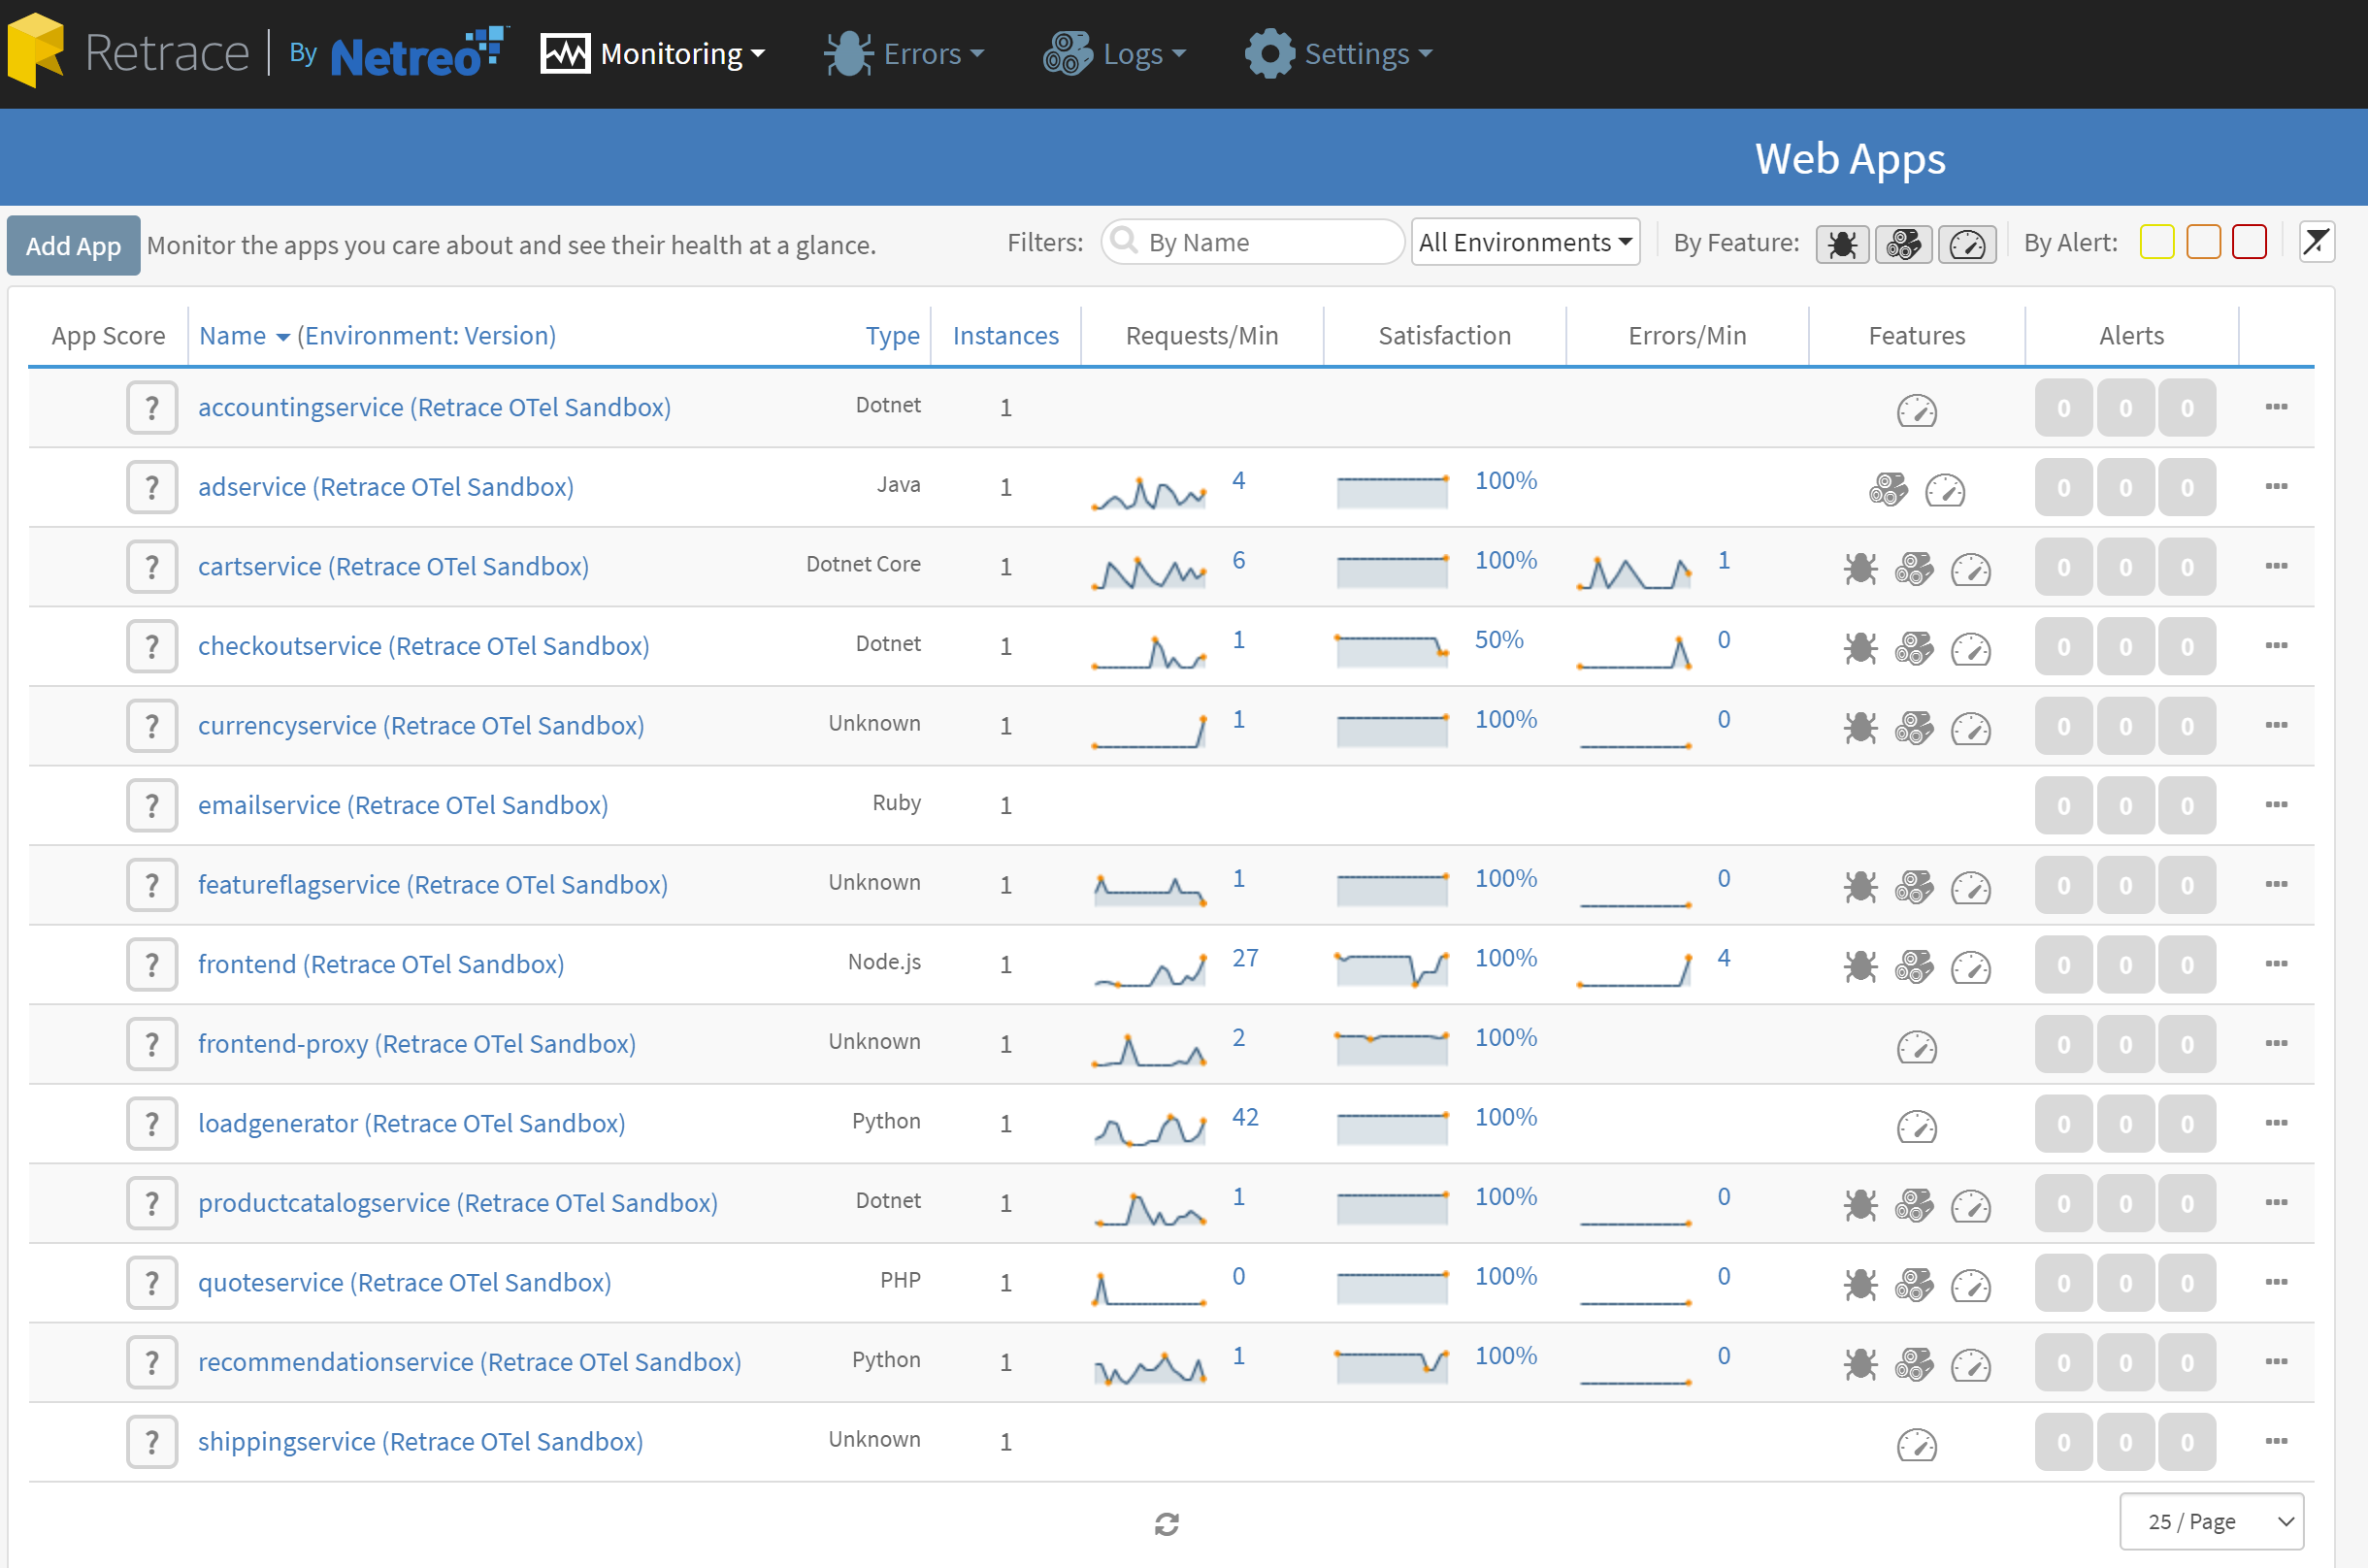
Step 7: Viewing your data in Retrace
Once the application is up and running and receiving traffic, you should be able to view your Application's performance data in Retrace: