It can be a challenge locating a specific log message when Errors and Logs from different servers, apps, and environments are are constantly being captured by the Errors and Logs Dashboards. With the improved Filters and Fields solution, you can easily zero in on a certain error or log message by simply applying the right fields and filters to your search. Below will give you an in depth look at how to best use this feature to quickly find what you are looking for.
Fields and Filters Overview
The interface for controlling the fields panel and filters bar include several different functionalities to make searching for errors and logs easier. Below will discuss the different parts of the screen as shown on the Logs Dashboard.
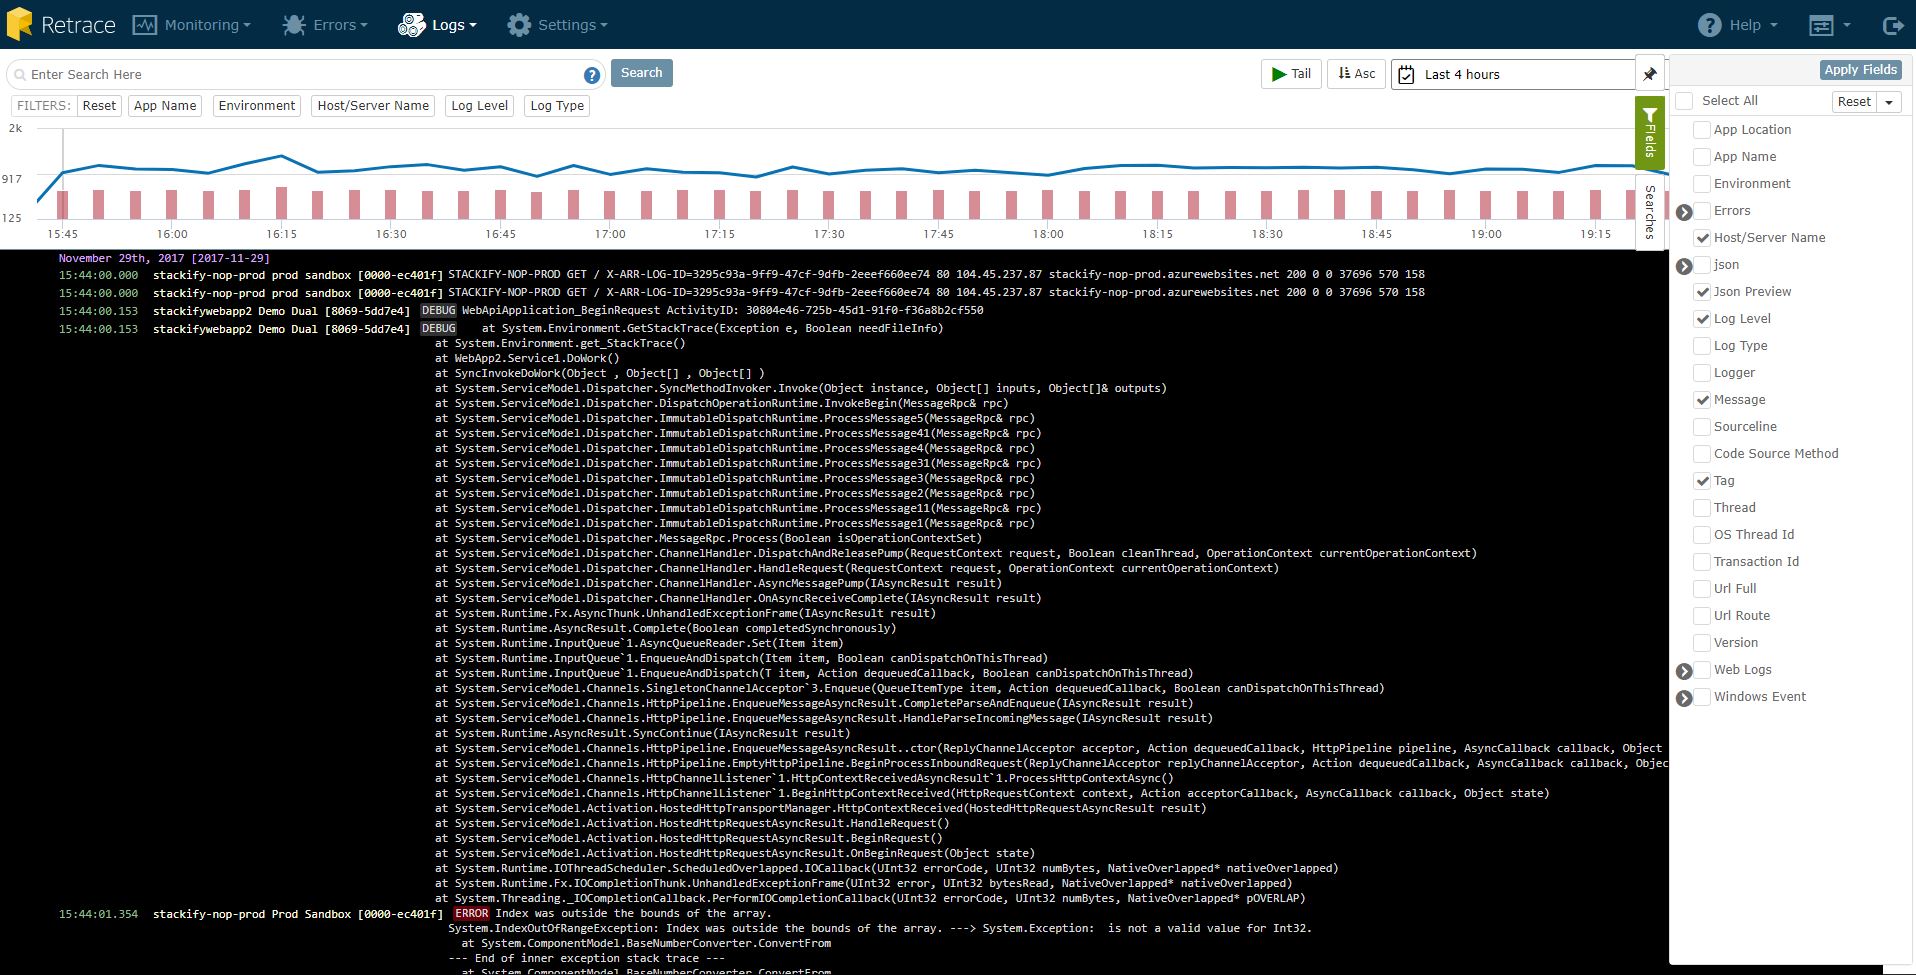
The Fields Panel
The Fields panel reflects the structure of a tree document that has categories and subcategories. You can view deeper fields by expanding applicable parent containers by clicking on the chevron icon next to the container.
You can select or deselect a field using the checkboxes to determine which log messages will appear in the dashboard. To filter the results, select the funnel icon next to the field to open the filter screen.
Note: For some fields there will be a grayed out icon indicating that a given field is not searchable.
Adjusting the Fields Panel
You can pin the panel to shift over the dashboard so the fields panel will remain expanded. You can also adjust the width of the panel up to 50% of the screen using the width adjusting icon seen above.
The Filters Bar
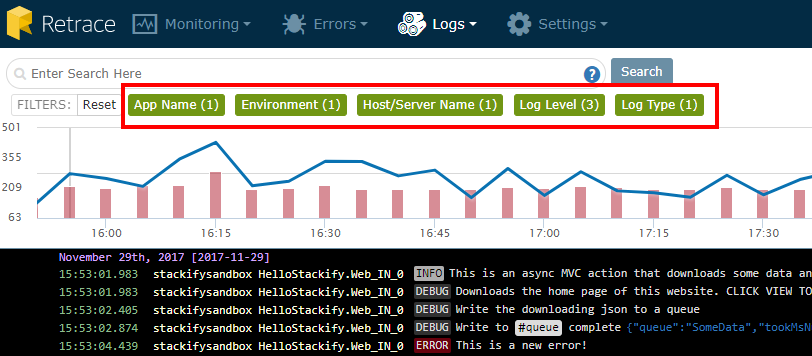
When you apply a filter from the Fields panel, the filter bar will appear above the log messages from the dashboard. All active filters will show up in the filter bar, along with the count of filter values being applied. The individual filter values will appear when hovering over a filter category. Filter values for different categories can be removed, or all filters can be removed at once by selecting “Reset”.
Fields
The list of fields in the panel reflect what messages are flowing into the dashboard. Each field in the panel can be selected to appear in the logs by selecting the appropriate checkbox. Below will show you the different types of filters you can apply to a field based on its category.
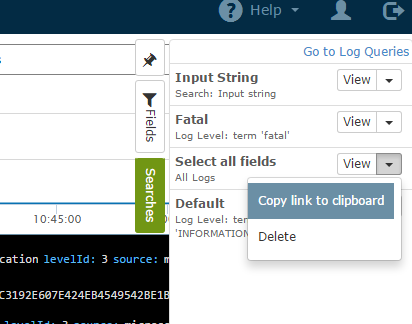
Saved Searches
You can save your searches so you can easily revisit them later in the Searches panel. Saving a search will apply any fields/filter combination you have set prior to clicking "Save".
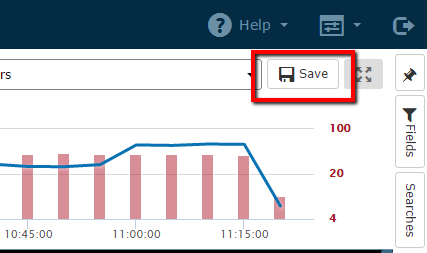
In the Searches panel you can view that search or copy the URL of a search you saved so you can bookmark it for easy retrieval later.
Filters and Fields for the Error Dashboard
The Error Dashboard has App names, Environment, and Host/Server names as default filters. When a given filter is applied, the filter will be highlighted green to show that it is active.
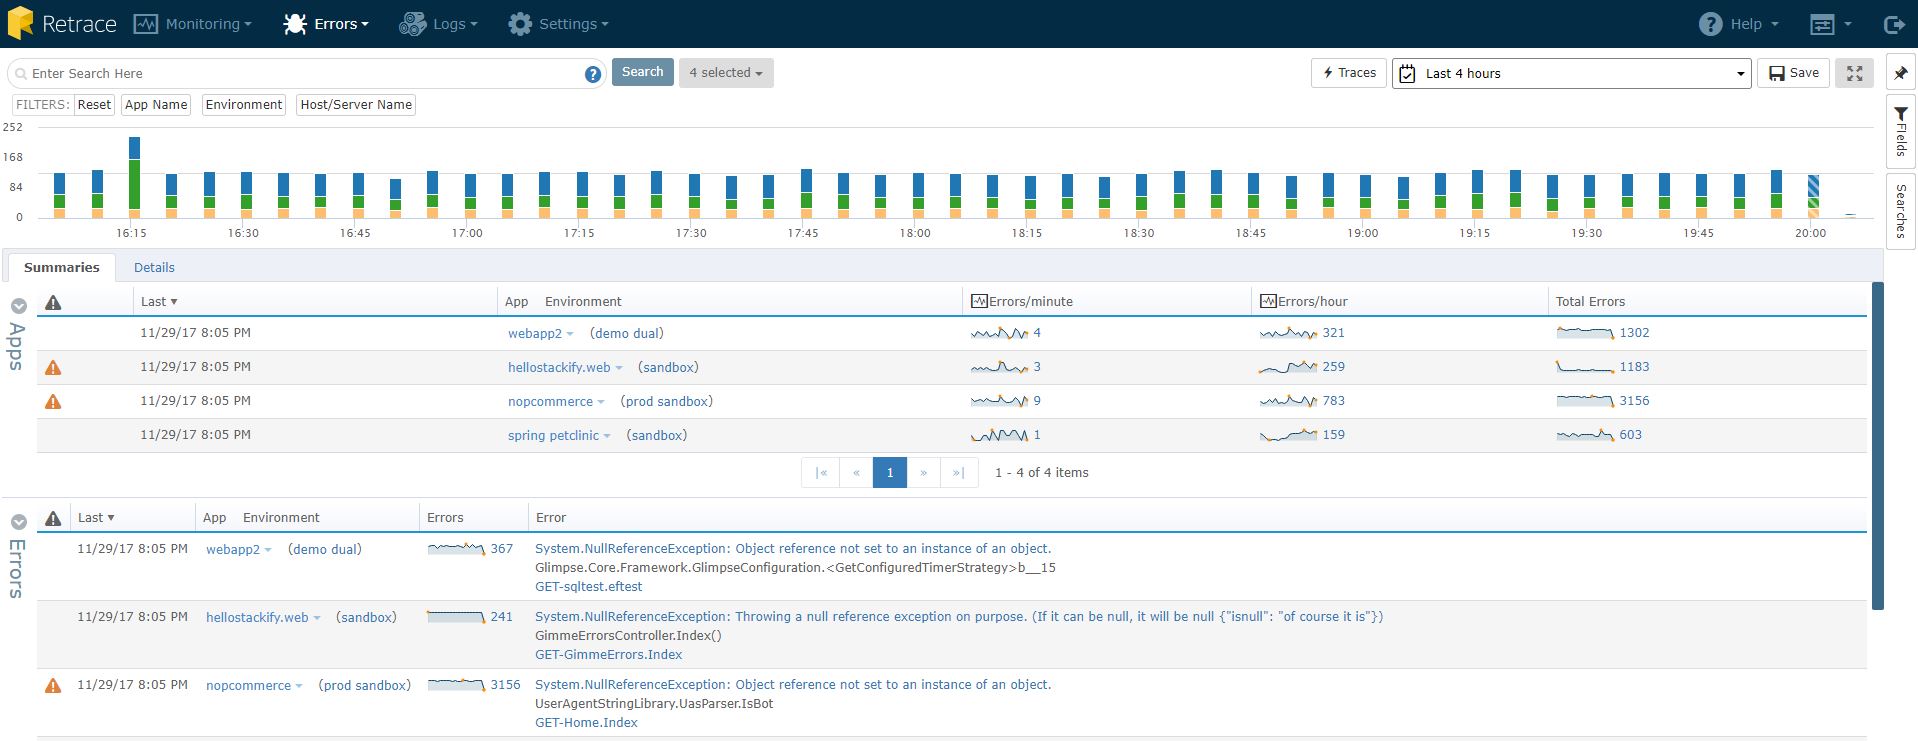
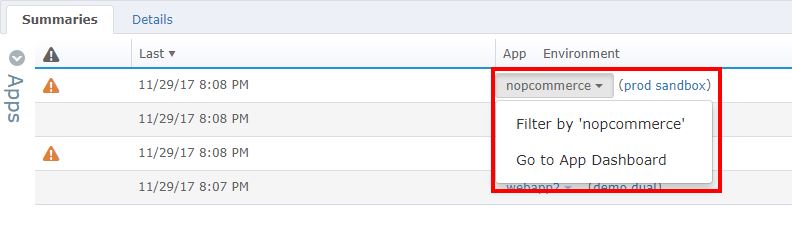
In addition to the default filters, you can also filter app name or environment directly by clicking on the app name or environment links at the bottom half of the Errors Dashboard page.