A big part of the Retrace equation is making sure you have good visibility into your production resources. This includes Apps, Servers/Roles/VMs, and Resources (websites, database queries, Azure Service Bus Queues/Topics, Files, etc.).
As a Getting Started exercise, we will point out some of the things you will want to focus on to ensure you're getting the best visibility possible into everything that's going on in your application and environment.
Setting Up Thresholds, Ranges, and Waiting Periods for Your Alerts
For both Server Monitor Templates and App Monitoring, you will have the option of establishing when an Alert will trigger. You do this by setting when and how an alert for a monitor fires.
Thresholds and Ranges
The first step is to establish what the threshold or range is. For example, if you wanted to receive an alert when CPU% for a server is greater than or equal to 95%, you would enter >=95 as the threshold. You can also control to be alerted when the monitor is within a range or outside of a range. As shown above, the operators (>, >=, <, <=, =, !=) are used to define thresholds and ranges.
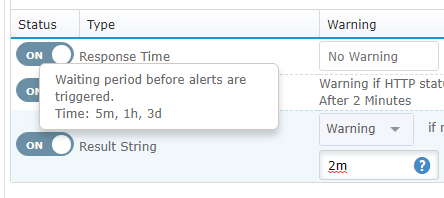
Waiting Periods
The next step is to establish the condition that will cause an alert to trigger after the threshold or range has been met, also referred to as the **waiting period. **An alert will trigger if the monitor is continuously above the threshold for the amount of time specified. As shown below, m(minutes), h(hours), and d(days) are used to specify time.
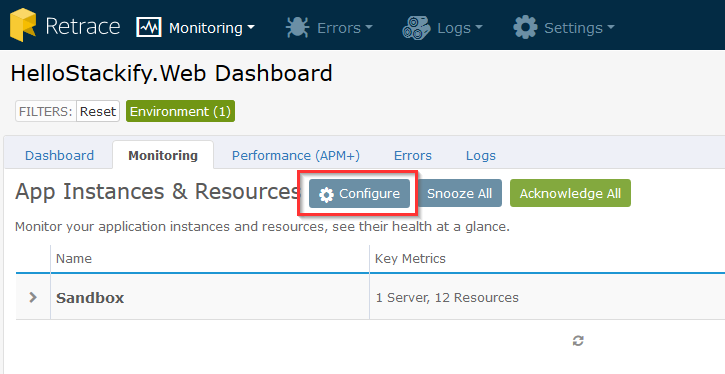
Configuring App and Resource Monitors From App Dashboard
Once you have installed the Retrace Monitoring Agent on at least one server running an App you want to monitor, you should see Apps in the Stacks page. From there, choose your App and configure App and Resource monitors in the App Dashboard.
To learn more on configuring monitoring for Apps, visit Configuring App Monitors. Below will show you how to add additional monitors to your servers.
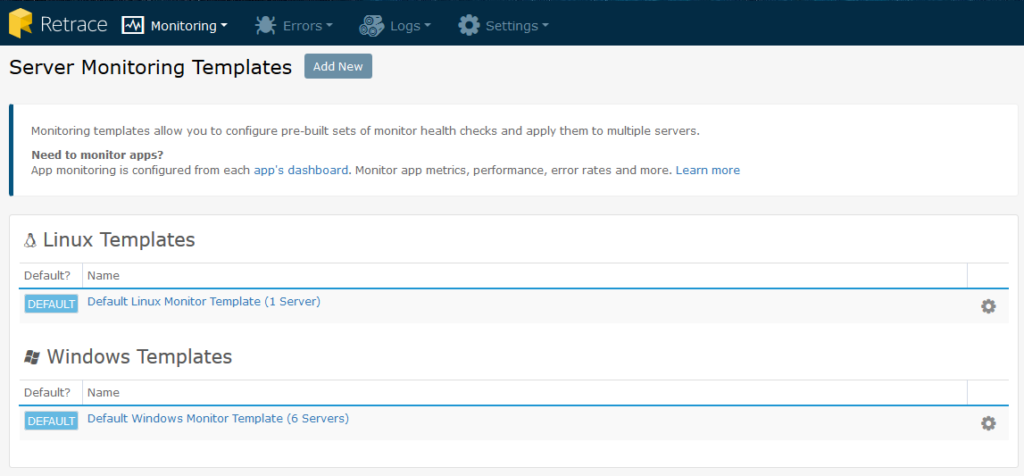
Configuring Server Monitors
The best way to set up monitors for your servers is with Server Monitor Templates. This feature allows you to set up templates with monitors and alerts and then assign servers to the template. This is a fast and easy way to ensure consistent monitor configuration for servers. To learn more about this feature and how to best use it, see the article on Server Monitor Templates.
Once these monitors are configured, you will be able to view the status of the server in the Server Dashboard.