By default Retrace only profiles applications hosted within IIS. If you want Retrace to capture transactions from an application running as a Windows service, please follow these directions.
Note: Web based .NET Core apps that are not hosted by IIS are not automatically profiled by default. Create a Stackify.json file to ensure they a profiled.
Retrace supports multiple types of .NET background services. Please review their installation guides for more details.
Step 1. Install Retrace Windows Agent
Option 1. New install in interactive mode:
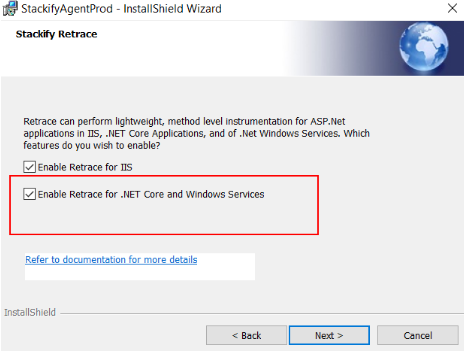
When installing, check the box for Enabling the Retrace for .NET Core and Windows Services.

Option 2. New install using command line:
"Stackify_[version].exe" /s /v"ACTIVATIONKEY=YOUR_KEY_HERE ENVIRONMENT="ENTER_ENVIRONMENT_HERE" ENABLEPROFILER=1
Note: set RestartIIS=1 to have Retrace automatically restart IIS to begin profiling web apps.
Note: For an existing install of Stackify:
- Modify [Install Drive]:Program Files >(x86)\Stackify\Stackify.ini
- Add AttachAll=1 to the [FEATURE] section
- Restart the “Stackify Monitoring Service” Windows Service
Step 2. Tell Retrace which services to profile with one of the below options
Option 1. Create a Stackify.json file
Stackify's latest .NET profiler looks for the existance of a Stackify.json file in the root folder of an application when the application is deployed. By simply adding this file as part of your project deployment, Retrace will automatically profile your application.
{
	"AppName": "MyApp",
	"Environment": "MyEnvironment"
}
Option 2. By using the “/EnableStackify” switch For an existing service, double check what the existing path is via the UI or by the command line “sc query” commands. Copy this path so you can use it via command line to update it.
You can then update the path via command line and add our command line switch to it like so:
CMD> sc config “My Service” binPath=”c:pathapp.exe /EnableStackify”
When you create your service, you may also provide this switch with the executable. For example, to install your service from a command prompt:

Option 3. By creating a “ProfileProcess.txt” file
This is a JSON formatted file that can define one or many EXEs to profile. This was the preferred way of the legacy profiler and still works with the new version. Although, we recommend creating the Stackify.json file instead.
[
    {"exe": "MyService.exe"},
    {"exe": "MyService1.exe"},
    {"exe": "SuperDuperService.exe"}
]
You may save this file:
- In the same folder as the .exe that is being profiled. This would allow you to easily “bin deploy” the file with your app.
- Into [Install Drive]:Program Files (x86)\Stackify
If you are running into issues around the .txt file getting parsed correctly, please ensure that the file is saved as UTF-8 encoding.
Step 3. Restart your service
After creating the ProfileProcess.txt you will need to restart your Windows Service.
Step 4. Define a transaction for Retrace
At this point, Retrace will begin profiling your code, and capture some data such as exceptions and errors, but to track a transaction through the app, you must add some instrumentation to your app via our library. Depending on the type of application, there are multiple ways to do this. To learn more and see examples, please see: Defining Custom Transactions