Many Retrace users are shifting away from physical hosts towards microservices, containers and serverless environments. The shift provides benefits, but creates challenges with performance monitoring for applications and services within these distributed systems. Up until recently, monitoring approaches were ad hoc and different for every system and service provider. OpenTelemetry - with support from all major cloud providers - is standardizing the generation and collection of telemetry data and simplifying how Retrace users and IT pros correlate both application and infrastructure telemetry.
Enter the Netreo OTel Appliance - an OpenTelemetry collector that enables vendor-agnostic processing and exporting of telemetry data. In our Monitoring AWS Lambda post, you’ll discover how the Netreo OTel Appliance simplifies how you monitor and optimize serverless applications and services.
Different vendors may have their own unique implementation of OpenTelemetry, but under the hood, they all comply with the OpenTelemetry standard. Listed below are the OpenTelemetry components that enable instrumentation of AWS Lambda.
OpenTelemetry Lambda Components
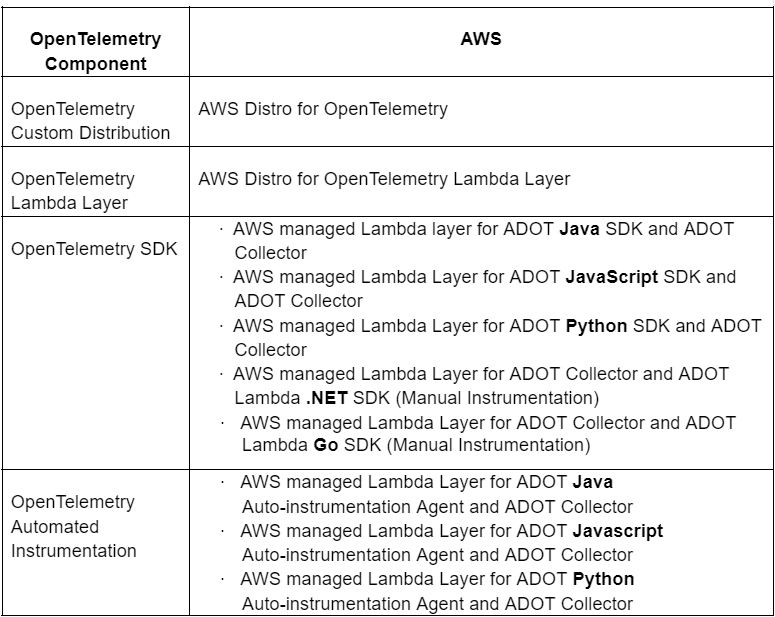
For languages that support automatic instrumentation in AWS managed Lambda layers, AWS Distro for OpenTelemetry Lambda Layer allows application teams to enable and disable OpenTelemetry for their Lambda functions without changing their code. For languages that don't support automatic instrumentation and for applications that require custom telemetry, the ADOT SDK and collector packages can be used.
Setting up your Netreo OTel Appliance
The first requirement for monitoring AWS Lambda in Retrace is the Netreo OTel Appliance. See Netreo OTel Appliance setup guide for more details.
Enable OpenTelemetry for AWS Lambda
To use OpenTelemetry in AWS Lambda, you can use the AWS Distro for OpenTelemetry (ADOT) Lambda Layer that’s compatible with the language you’re using. The ADOT Lambda Layer includes the OpenTelemetry SDK and OpenTelemetry Collector. This can be done by adding the ADOT Lambda Layer using the AWS Portal to automatically instrument your Lambda function. See the Lambda Auto-instrumentation guide for more details.
Configure AWS Lambda to use Netreo OTel Appliance
For AWS Lambda, Netreo OTel Appliance ingest data either via AWS Lambda Collector or directly from AWS Lambda.
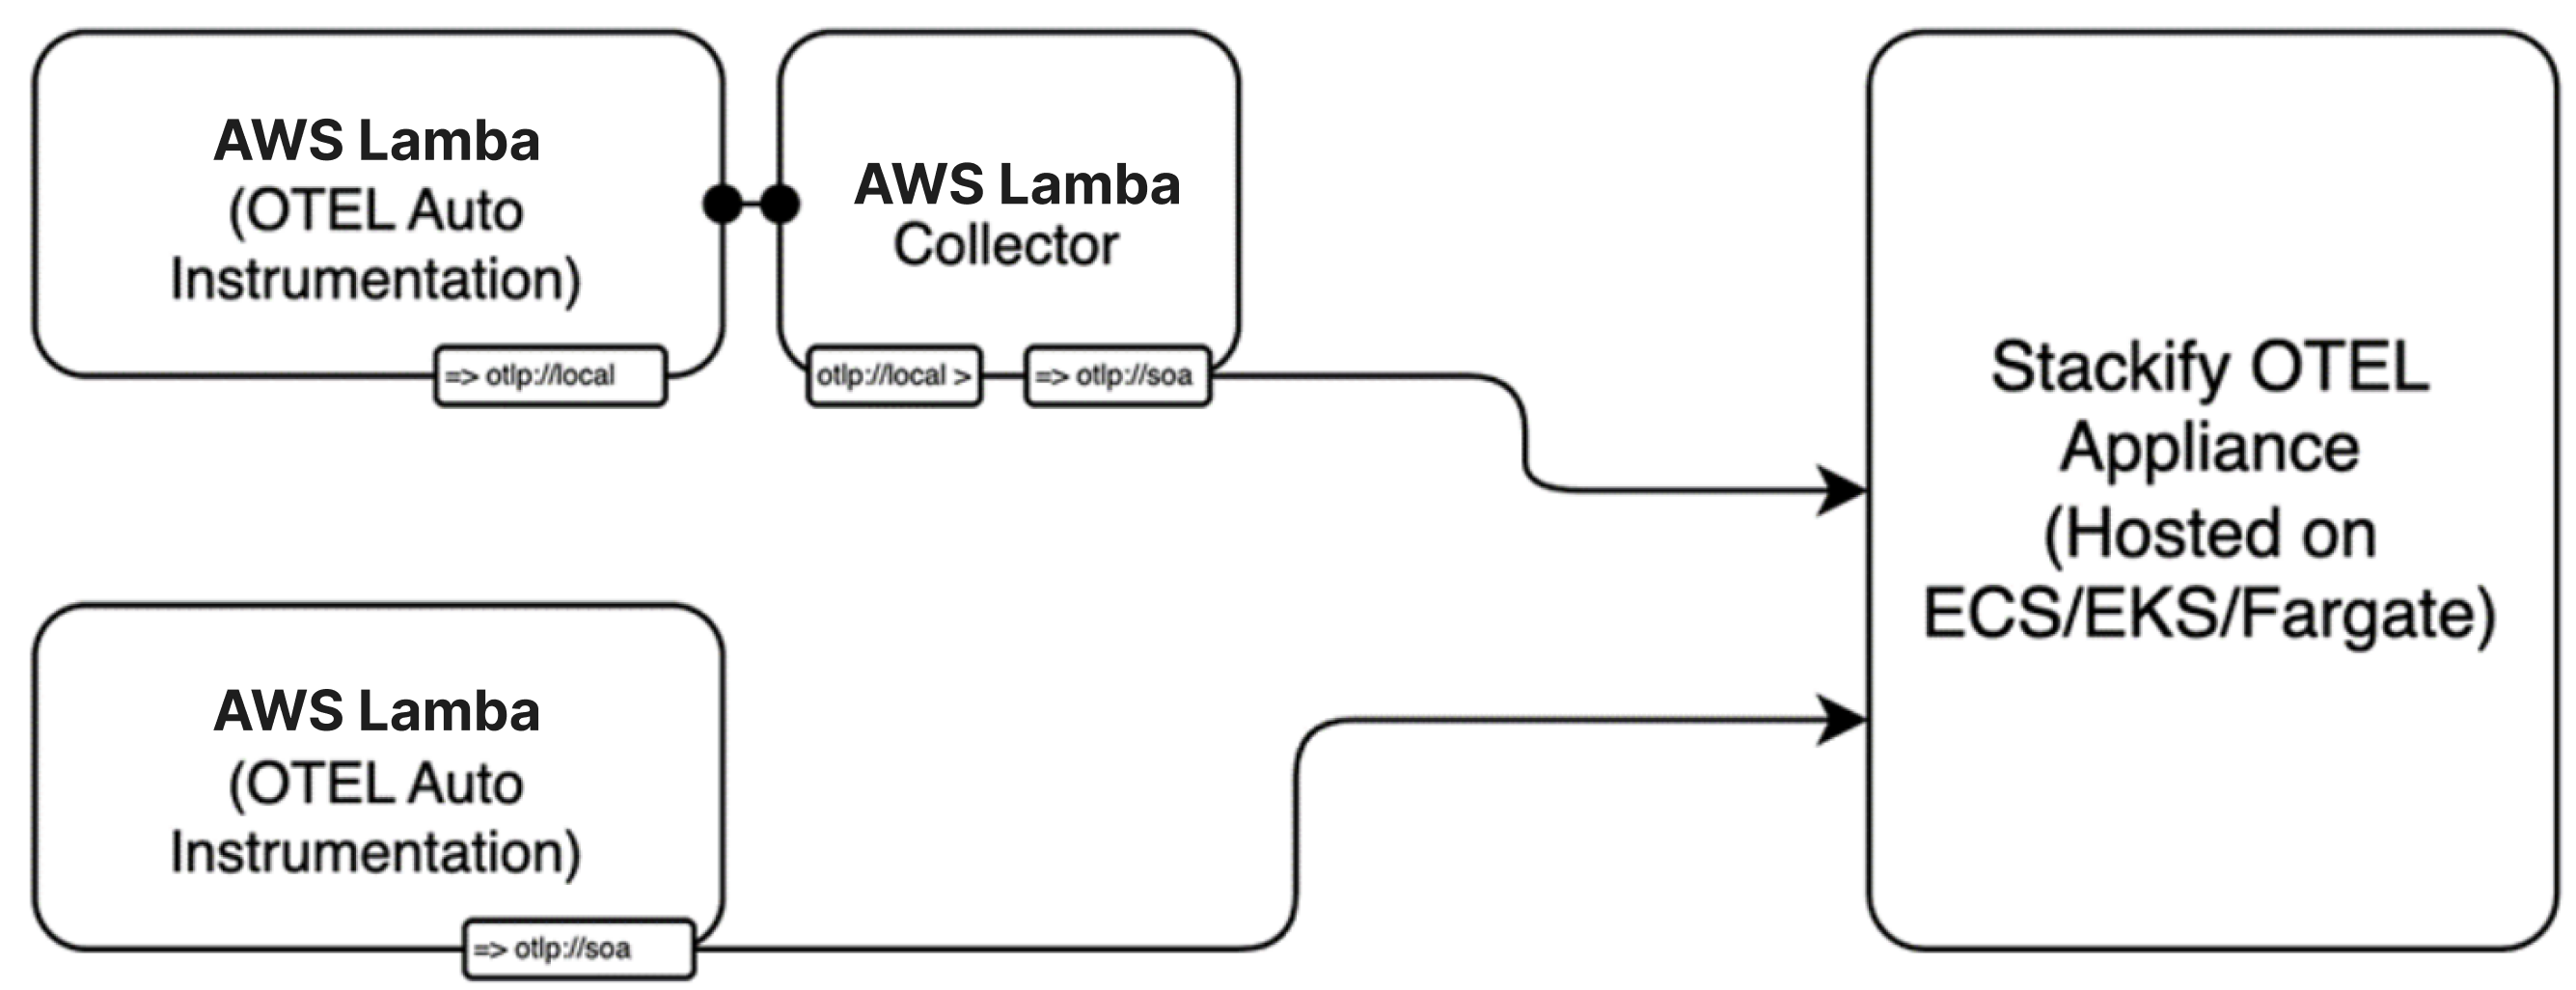
To point the AWS Lambda Collector to the Netreo OTel Appliance, there are 2 options:
Option1: You can create an environment variable in the config.yaml file and then include it in the Lambda function.
OPENTELEMETRY_COLLECTOR_CONFIG_FILE: /var/task/collector.yaml
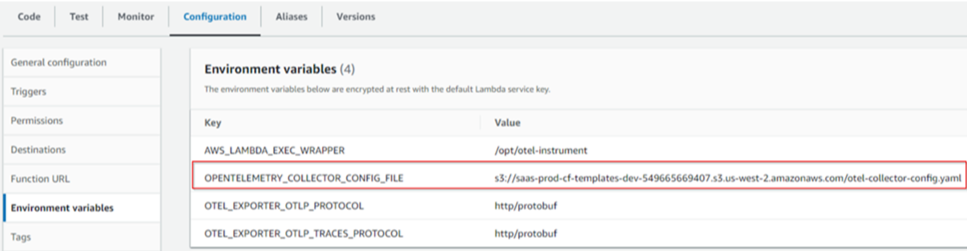
Option2: You can upload your config.yaml in an S3 bucket and add an environment variable
OPENTELEMETRY_COLLECTOR_CONFIG_FILE: s3://.s3..amazonaws.com/config.yaml
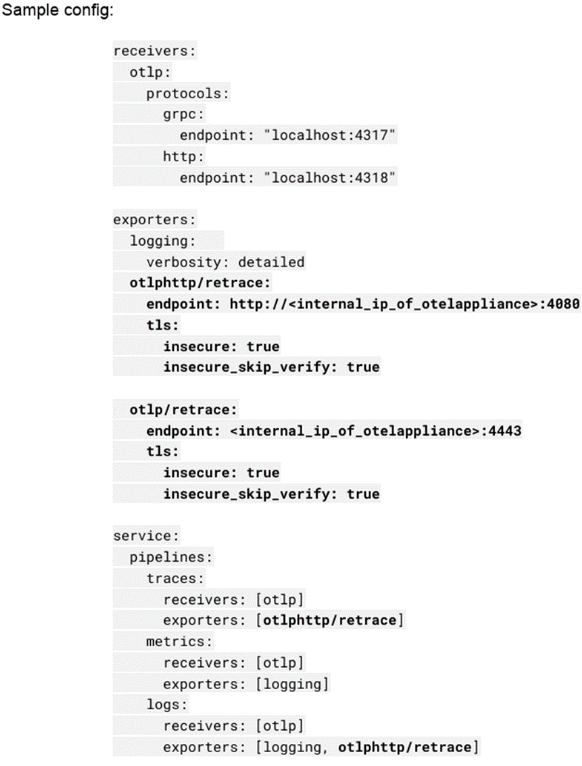
Create a Service Provider and set up the OTEL LogExporterEndpoint and point it to the Retrace OTEL Appliance. This step is ADOT Lambda Layer package dependent.
.Net ADOT Lambda Layer Sample:
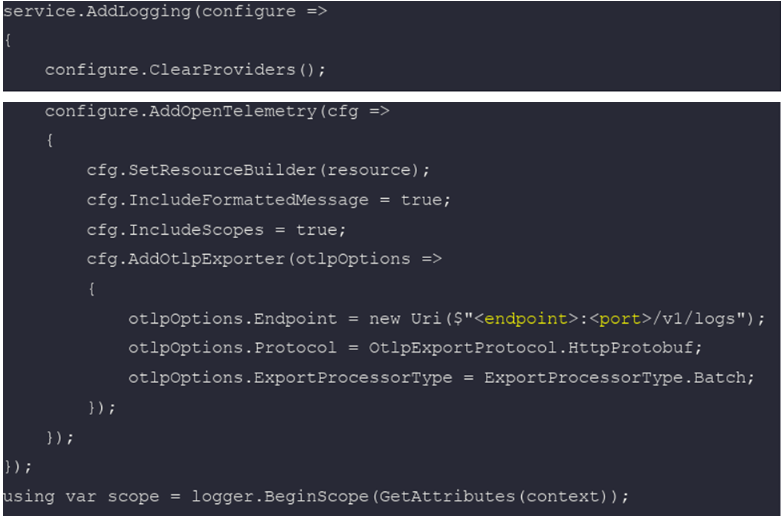
(Be sure to update the endpoint and port number based on your appliance configuration)
The ADOT Collector for Dotnet only supports Trace and Metrics, so the OpenTelemetry LoggingProvider must be manually added into your code. Optionally, you can use Dependency Injection.
Add scope properties:
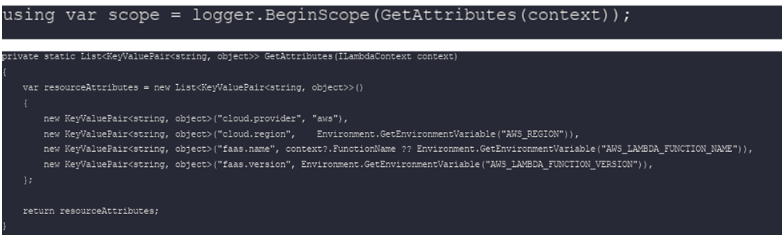
This allows logs to be properly identified by the app as they are ingested by the Retrace OTel appliance
Properties to set:
- cloud.provider: aws
- cloud.region: ○ faas.name :
- faas.name :
The setup may differ per language specific lambda layer but the concept is basically the same.