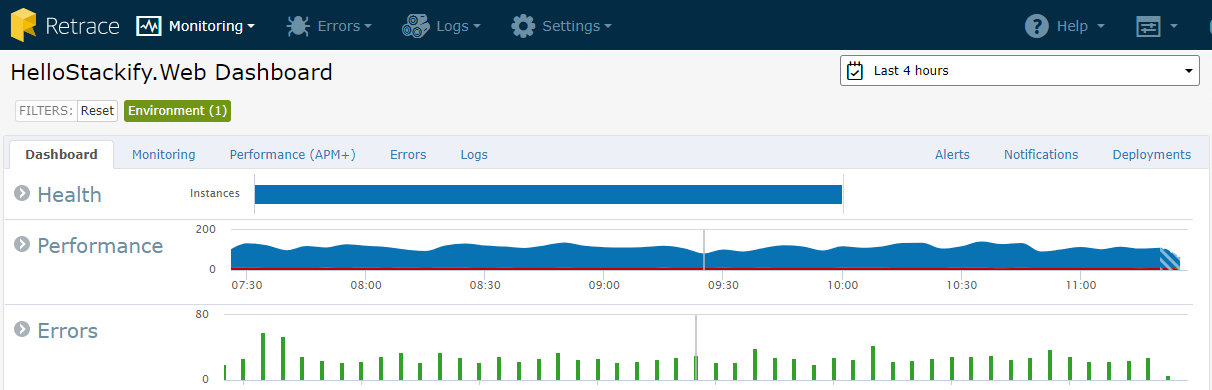
There are three sections to the Dashboard tab inside the App Dashboard that allow you a quick insight to how your app is performing overall. By default the App Dashboard is filtered by the App/Environment that you selected from the Web Apps list.
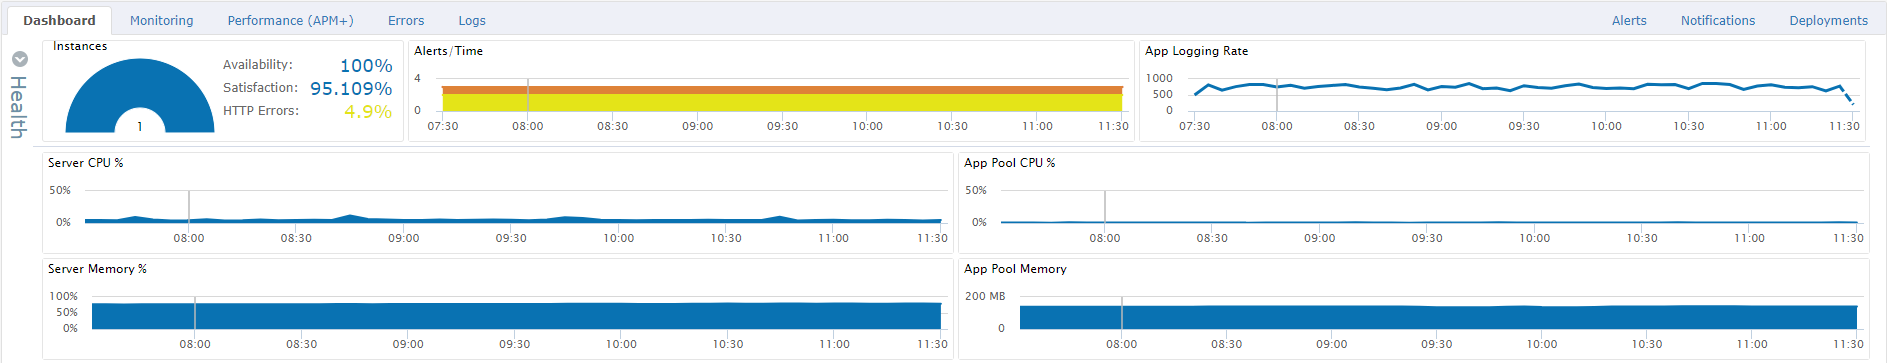
Health
The Health section is always expanded by default upon entering the Dashboard tab of the App Dashboard. Here you can see a quick overview of the applications health metrics, such as, the amount of app instances, app availability, Satisfaction score, Http Errors, as well as server health related metrics about the server that the app is hosted on.
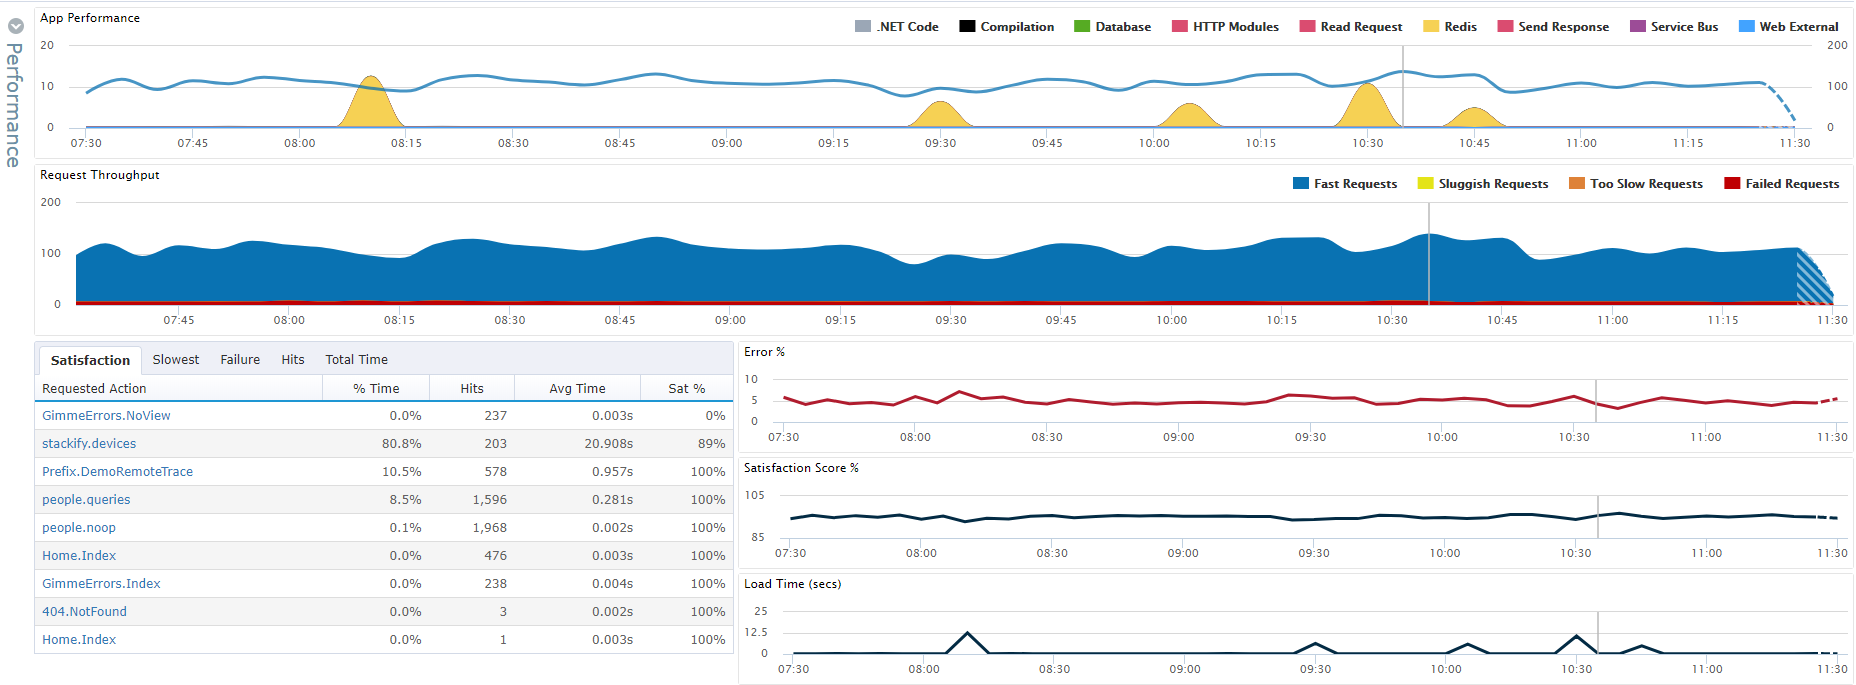
Performance
The Performance section gives you an overview of your apps request performance at a glance. You can hover over the graphs to get a breakdown of the individual stat load times. Request Throughput helps give you an idea of the average request time. Also you can see the top nine requests in the chart below.
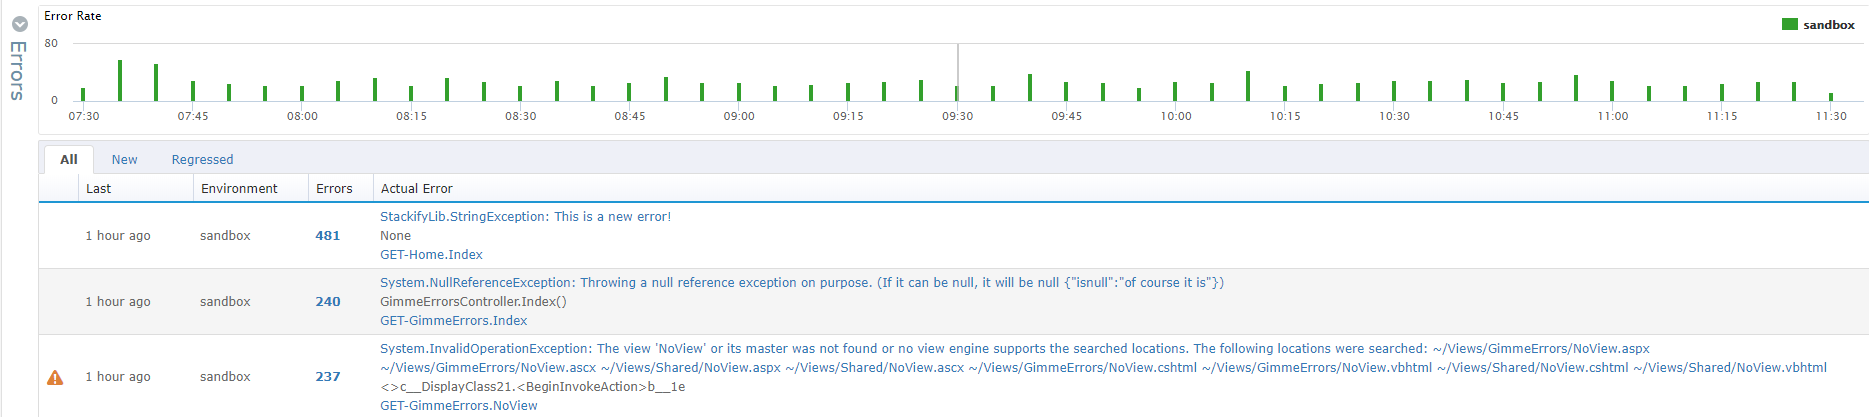
Errors
The Errors section gives details around error rates and individual errors once you have configured errors for your app. You can also filter by choosing the New or Regressed tabs to confine your search. To learn more about configuring errors take a look at Errors and Logs: Overview.