One of the ways we strive to deliver relevant insights is to only collect traces around interesting requests. Some examples of these request types that are interesting would be faster than normal, slower than normal, new web requests, requests introducing new SQL, requests introducing new exceptions, or abnormal satisfaction scores. Under performing requests will be profiled more often than fast requests. As long as the app is getting steady traffic Retrace should be saving a trace every 5 to 15 minutes.
The idea behind a Trace is to highlight problem areas in your application while still giving a general summary on the performance of the average requests of that kind.
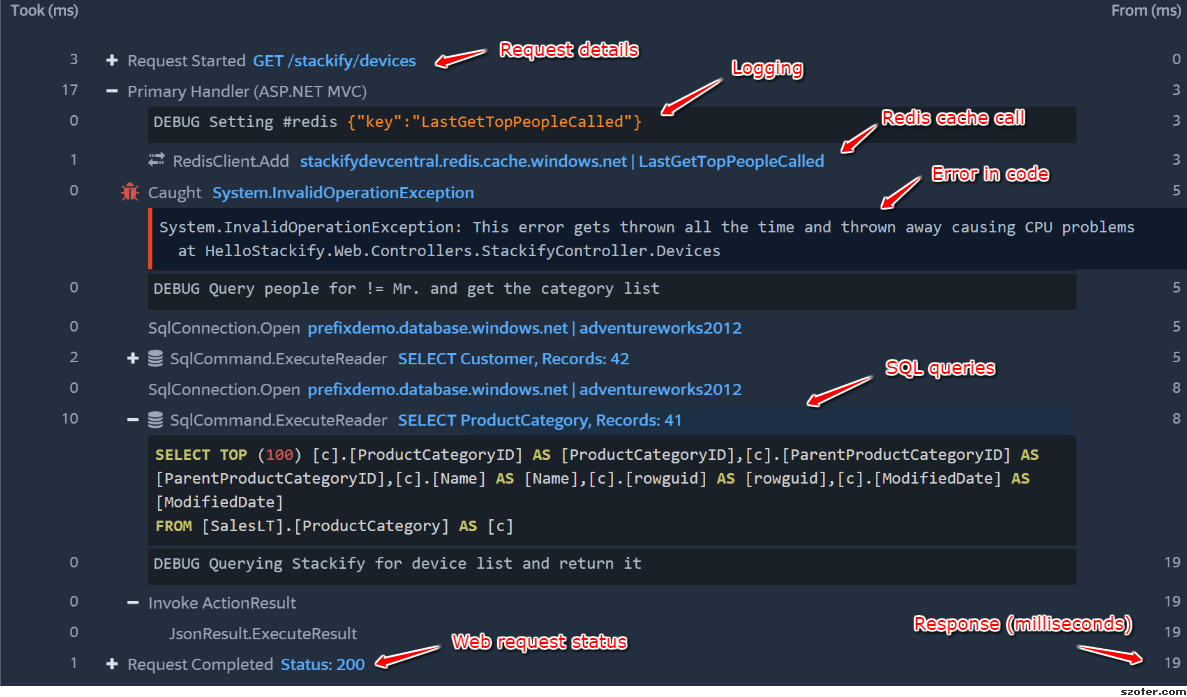
Example Trace
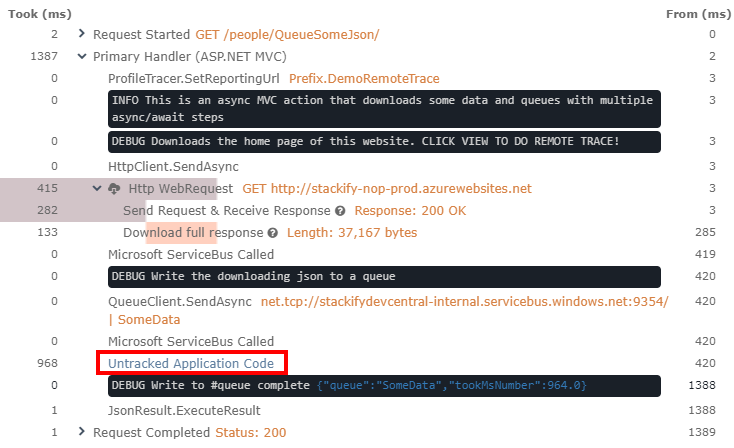
Both Prefix and Retrace provide the same type of detailed trace view. This screenshot below is from Prefix.
Untracked Time
If you wish to see untracked time in your traces, please contact support in order to activate this setting for your account.
In Retrace it is possible to show where untracked time may be appearing within a trace.
This can be helpful for better visualizing when timing gaps in a trace occur. Timing gaps can occur for a number of reasons and may not be related to the actual trace. However, in some scenarios adding custom instrumentation can help identify where this time is being spent if it is occurring within the execution of the request itself.
The section below will outline how you can add Custom Instrumentation to your code.
Getting more from your Traces
If you see “Untracked Time” in the trace structure, as mentioned above, custom instrumentation could help.
Timing gaps within a trace can occur because of how we optimize profiling, or for other reasons not related to the profiler. In some cases these gaps can potentially be filled by customizing the profiler instrumentation for your language.
Custom instrumentation will allow you to specify what Namespaces and Methods you would like to always be profiled. That way when a web request or transaction occurs, you will have insight into the methods being called and what your code is doing.