What is Open Telemetry?
Open Telemetry (OTel) is an open-source observability protocol for collecting telemetry data and exporting it to a target system to make observability data collection vendor agnostic. OTel aims to provide a unified set of tools, APIs, and software development kits (SDKs) for collecting data and transferring it using an open standard for adding observable instrumentation to any application. OTel enables IT teams to instrument, generate, collect, and export telemetry data for analysis and understand software performance and behavior.
Observability is the ability to understand what is happening inside a system from the knowledge of the external data it produces, which are usually logs, metrics, and traces. To make a system observable, the code emits traces, metrics, and logs. The instrumented data is then sent to an observability back-end.
For more information about Open Telemetry visit OpenTelemetry.io
Configuring OTel in Prefix
To send OTel data to Prefix, configure exporter routes in the application or collector to point to Prefix.
To configure Open Telemetry in Prefix, complete the following steps:
- Open the main application window.
- Select Settings or the “hamburger” menu > Preferences to get the route from Prefix.
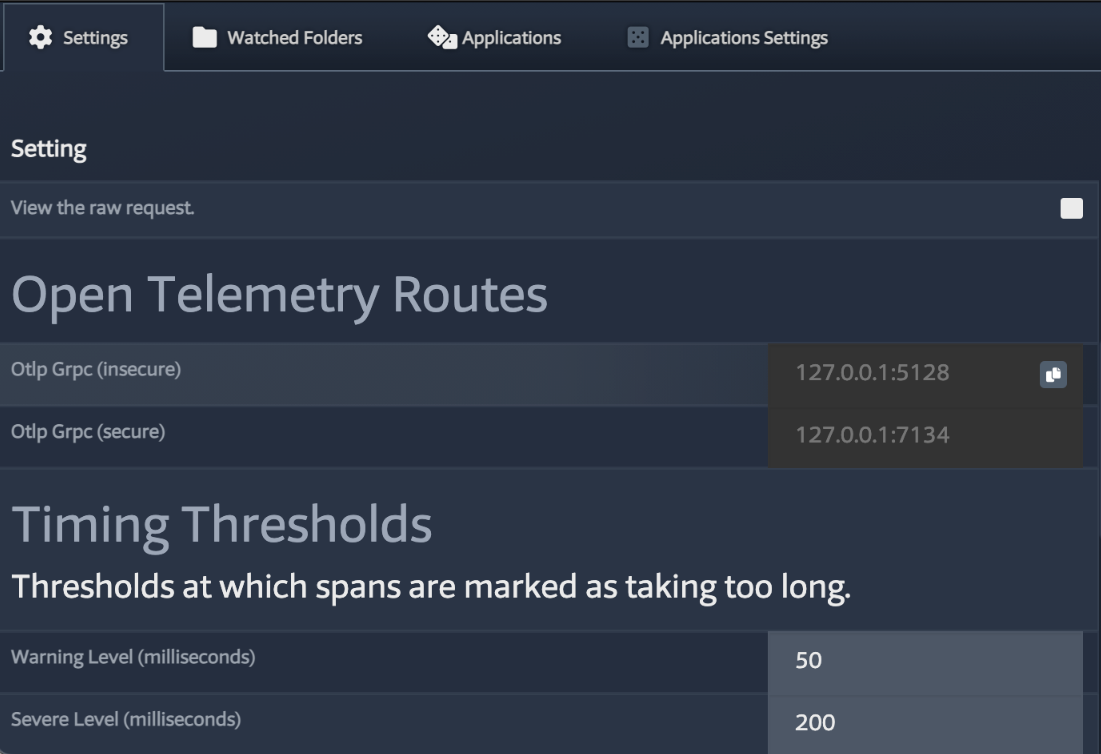
- Select gRPC (secure or insecure) for the connection.
Note: GRPC Secure is recommended since it is the native format for OpenTelemetry.
- Configure OTel data source to point to Prefix.
-
See your application documentation for instructions to configure OTel data exporter settings.
or
-
Use the collector gateway to configure the OTel data exporter settings for Prefix.
-
exporters:
 # assumes the collector lives inside a docker container.
  otlp/prefix:
    endpoint: host.docker.internal:7134
    tls:
      insecure: true
      insecure_skip_verify: true

service:
  pipelines:
    traces:
      receivers: [otlp]
      processors: [batch]
      exporters: [otlp/prefix]
    logs:
      receivers: [otlp]
      processors: [batch]
      exporters: [otlp/prefix]
Note: Find more examples at https://github.com.
- In the collector .yaml file, add an exporter for Prefix, such as
otlp/prefixin the example code. - Include the
otlp/prefixinside the exporters of the services for both trace and log services as shown in the example. - Restart the collector.
Open Telemetry Routes
Open Telemetry routes are the settings that are used inside the collector or the application that sends OTel data to Prefix. Prefix supports the OTLP format for trace and log streams from an OTel data source or application.
Viewing Properties
To view OTel properties, click the OpenTelemetry icon.
Click the CSV icon to export the list of properties to a designated file location.
Configuring Prefix to Use Custom Routes
To change which ports Prefix uses for GRPC, update the prefix.json configuration file. You can find this file in one of the following file paths depending on the operating system:
- MacOS:
~/Library/Application Support/Prefix/prefix.json - Windows:
C:\ProgramData\Prefix\prefix.json - Linux:
~/.config/prefix/prefix.json
The following is a sample configuration using the default ports:
{
  "Stackify": {
     "Grpc": {
        "HttpPort": 5128,
        "HttpsPort": 7134
     }
  }
}