Prefix Premium allows you to dive even deeper into your code to view trace transactions across servers, compare performance stats from QA and production, and track any method in your code.
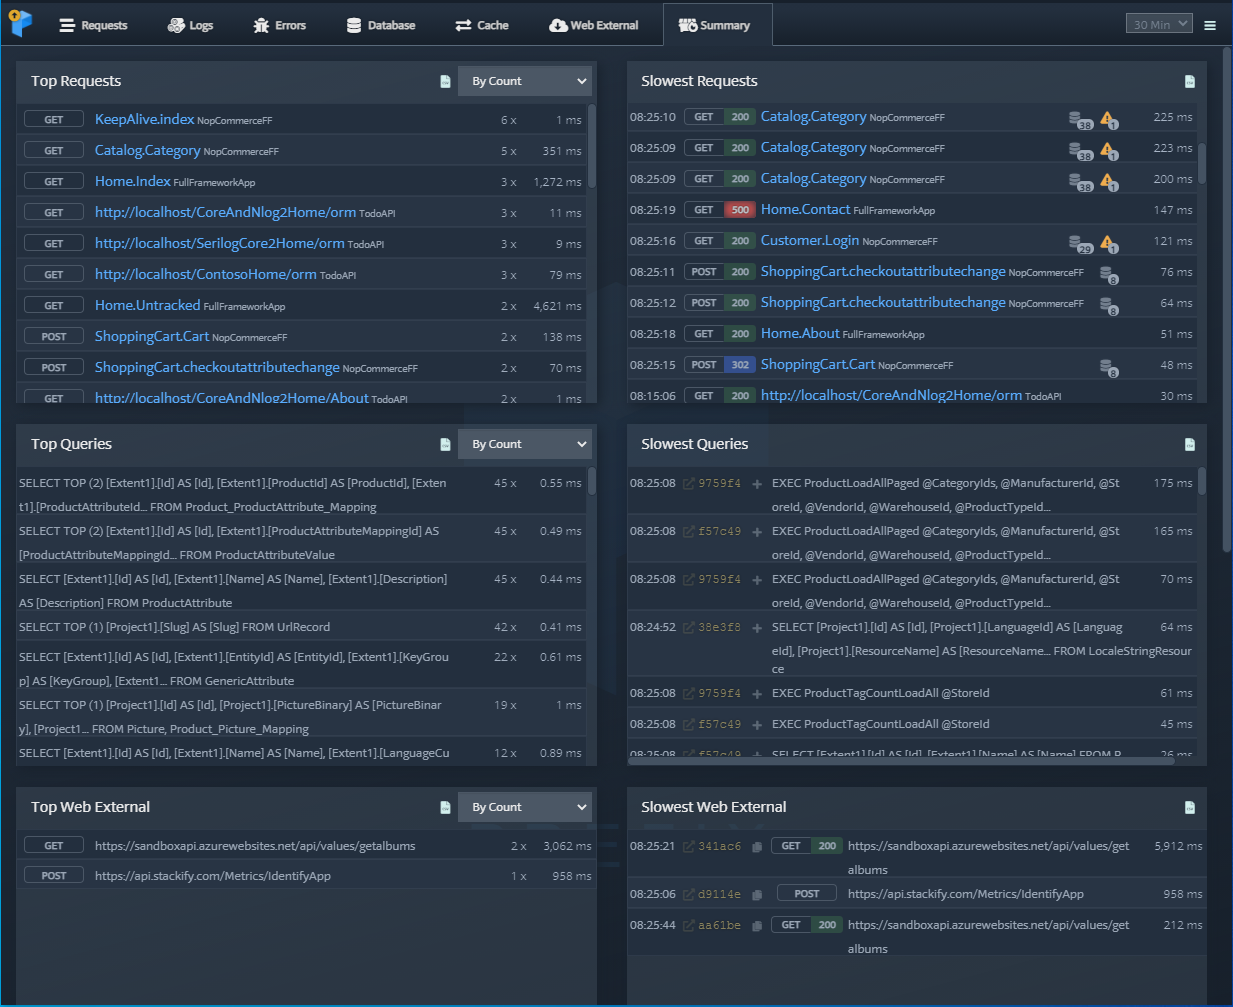
Summary Dashboard
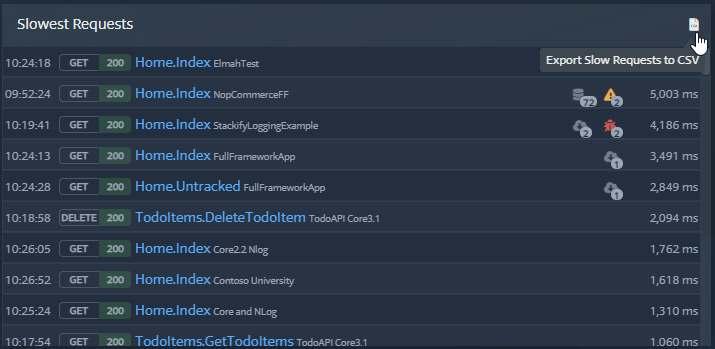
Quickly view the slowest and top occurrences of requests, Dependencies, sql queries, web externals, and cache calls as well as top errors for your applications. At a glance you can identify the slowest calls, the most used requests, and identify where you should invest time on improving your application. Each summary box can also be exported as a CSV for later review.
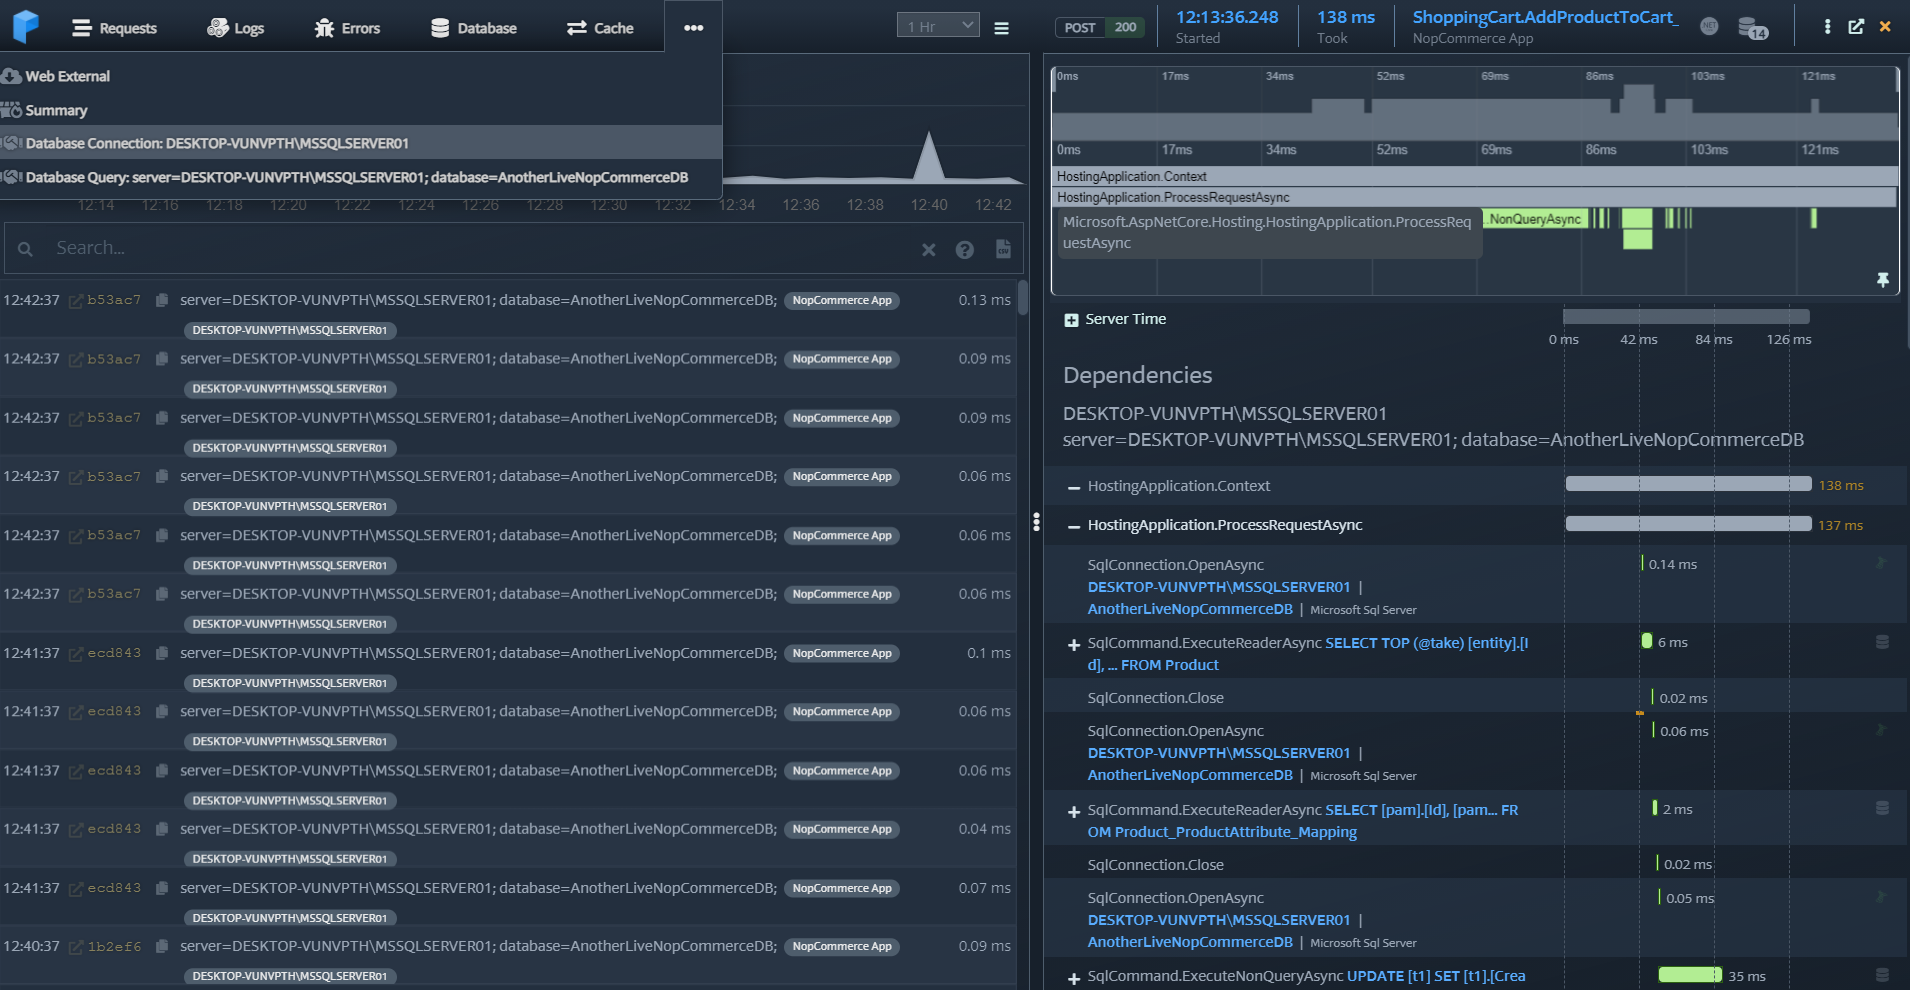
Dependancy Dashboards
When looking at a trace, at the top will be a list of the top level hosts that contain dependencies that are part of that request, when available. A badge will be available to the right. When you click on the dependency badge, a new tab will open a Dependency Dashboard view that lists all of the dependencies for that selected host. Each new dashboard opened will create a new tab so that you can compare information.
Custom Thresholds
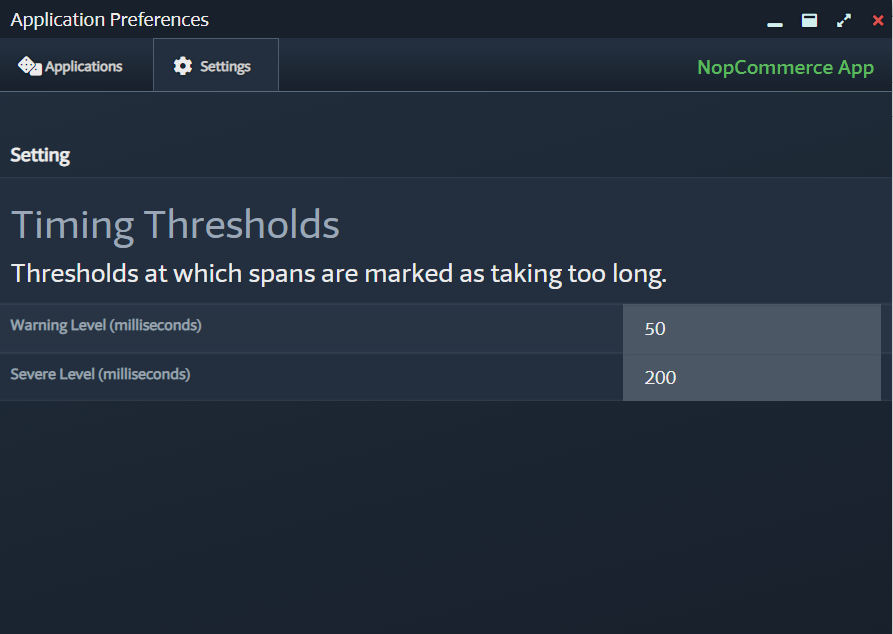
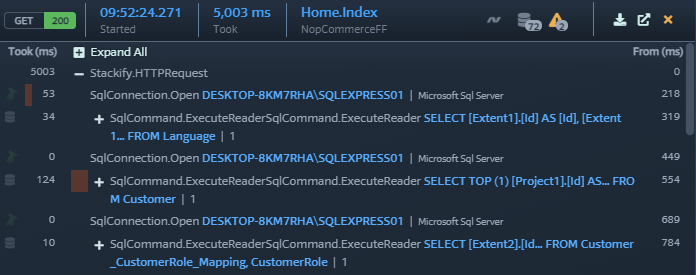
Custom Thresholds allow you to set the warning and sever timings that will be used to call out requests that are taking too long. By default, Prefix uses defaults based on industry best practices. The Custom Thresholds will allow you to change these thresholds based on each application you are profiling. This will show in the time taken numbers when looking at a trace breakdown- warning in orange and severe in red.
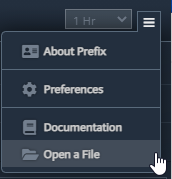
To access the Custom Threshold editor, click the hamburger menu -> App Preferences
The Applications tab lets you configure the thresholds differently for each application.
The Settings tab will let you change the thresholds for all profiled apps at once.
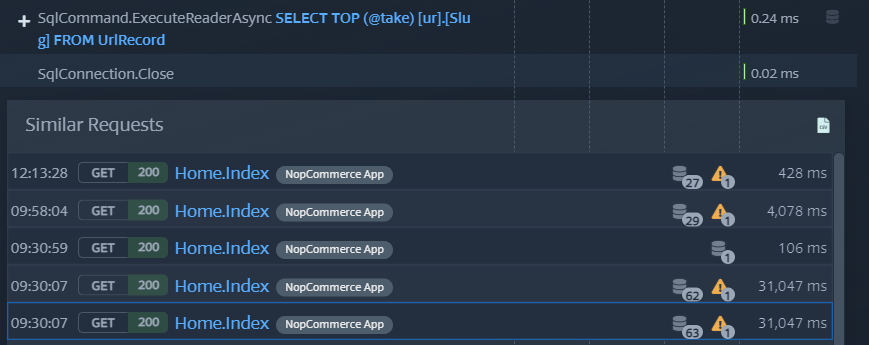
Similar Requests
All requests that match the currently selected request’s signature will be shown in a list at the bottom of the trace. This allows you to quickly identify common issues across requests.
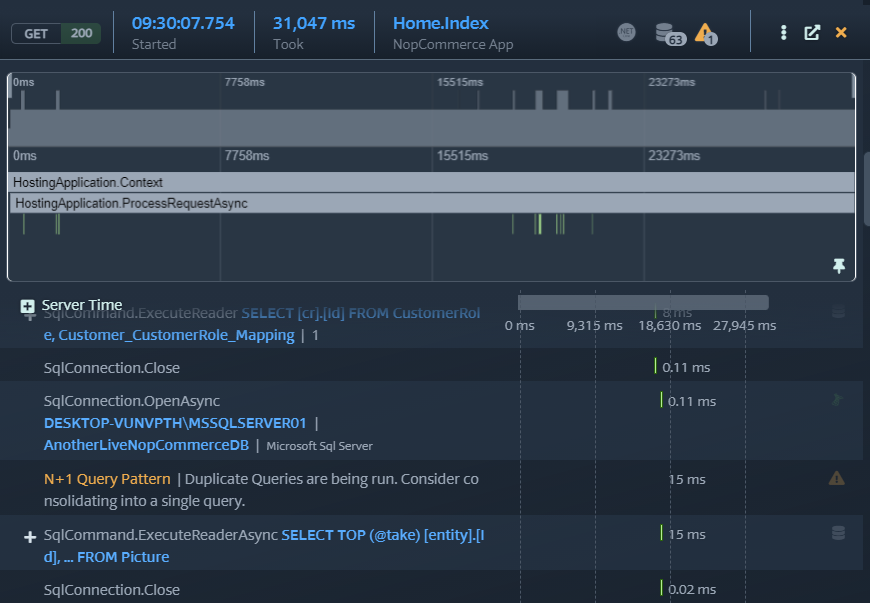
Smart Suggestions
Look for the yellow warning triangles by your Requests. The count will be shown at all times, but with a Premium license you will see suggestions for improving the quality of code. These are just suggestions and should be implemented at your own discretion.
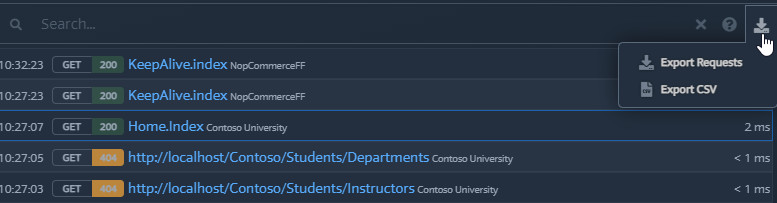
Export CSV
You can find the Export CSV functionality by looking for the csv or download icons in the top right corners of the view. This will allow you to export any grid you see. CSV files can be exported for requests, logs, errors, database queries, and any of the slowest or top items seen on the summary tab.
Export Trace
You can export a single trace or multiple traces. To do so look for the Export icon in the upper right of the requests view. Selecting the Export requests option will allow you to select one or multiple requests by checking the checkboxes to the left. After making your selections you will then click the “Export Button” and specify where you want the file to be saved.
When viewing a specific trace, the export icon at the top of the trace will allow you to export that single trace and specify where you want the file to be saved.
Preferences Screen
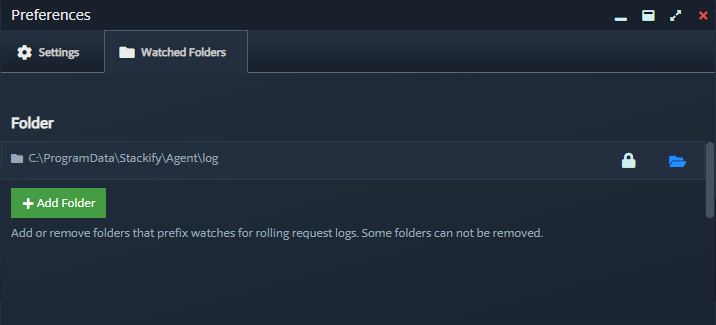
Add additional folders that Prefix will monitor for rolling request logs. This is to support scenarios such as docker containers, VMs where profiler outputs are in non-standard directories, remote mounted drives for those who develop on a remote vm or other similar situations. The preferences screen can be accessed via your tray or in the application itself in the hamburger menu.
To add an additional folder for Prefix to monitor, select the “Watched Folders” tab then click the “Add Folder” button to specify which folder you would like to monitor.
Open a File
This can be a previously exported log or trace file you saved from Prefix or Retrace. Importing .log or .trace files from Retrace will allow you to easily compare your Production code to your development environment and see real time improvements you’ve made.