This guide is intended to help users who are experiencing problems trying to configure their application to send APM data to Retrace. If you haven’t already, check out our documentation on installing Retrace for your appropriate application framework.
If you are using Azure App Services, Elastic Beanstalk, or other deployment models, those installation guides may provide additional troubleshooting details.
This guide is designed for Retrace, although many of the troubleshooting steps also apply for Prefix. If you are having problems with Prefix, please also see our troubleshooting guide for Prefix.
Verifying Retrace Installation Basics
If you are having problems with Retrace APM not working, the issue is most likely something very simple.
1. Is APM enabled?
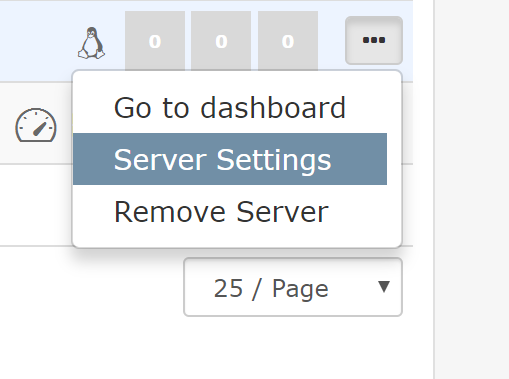
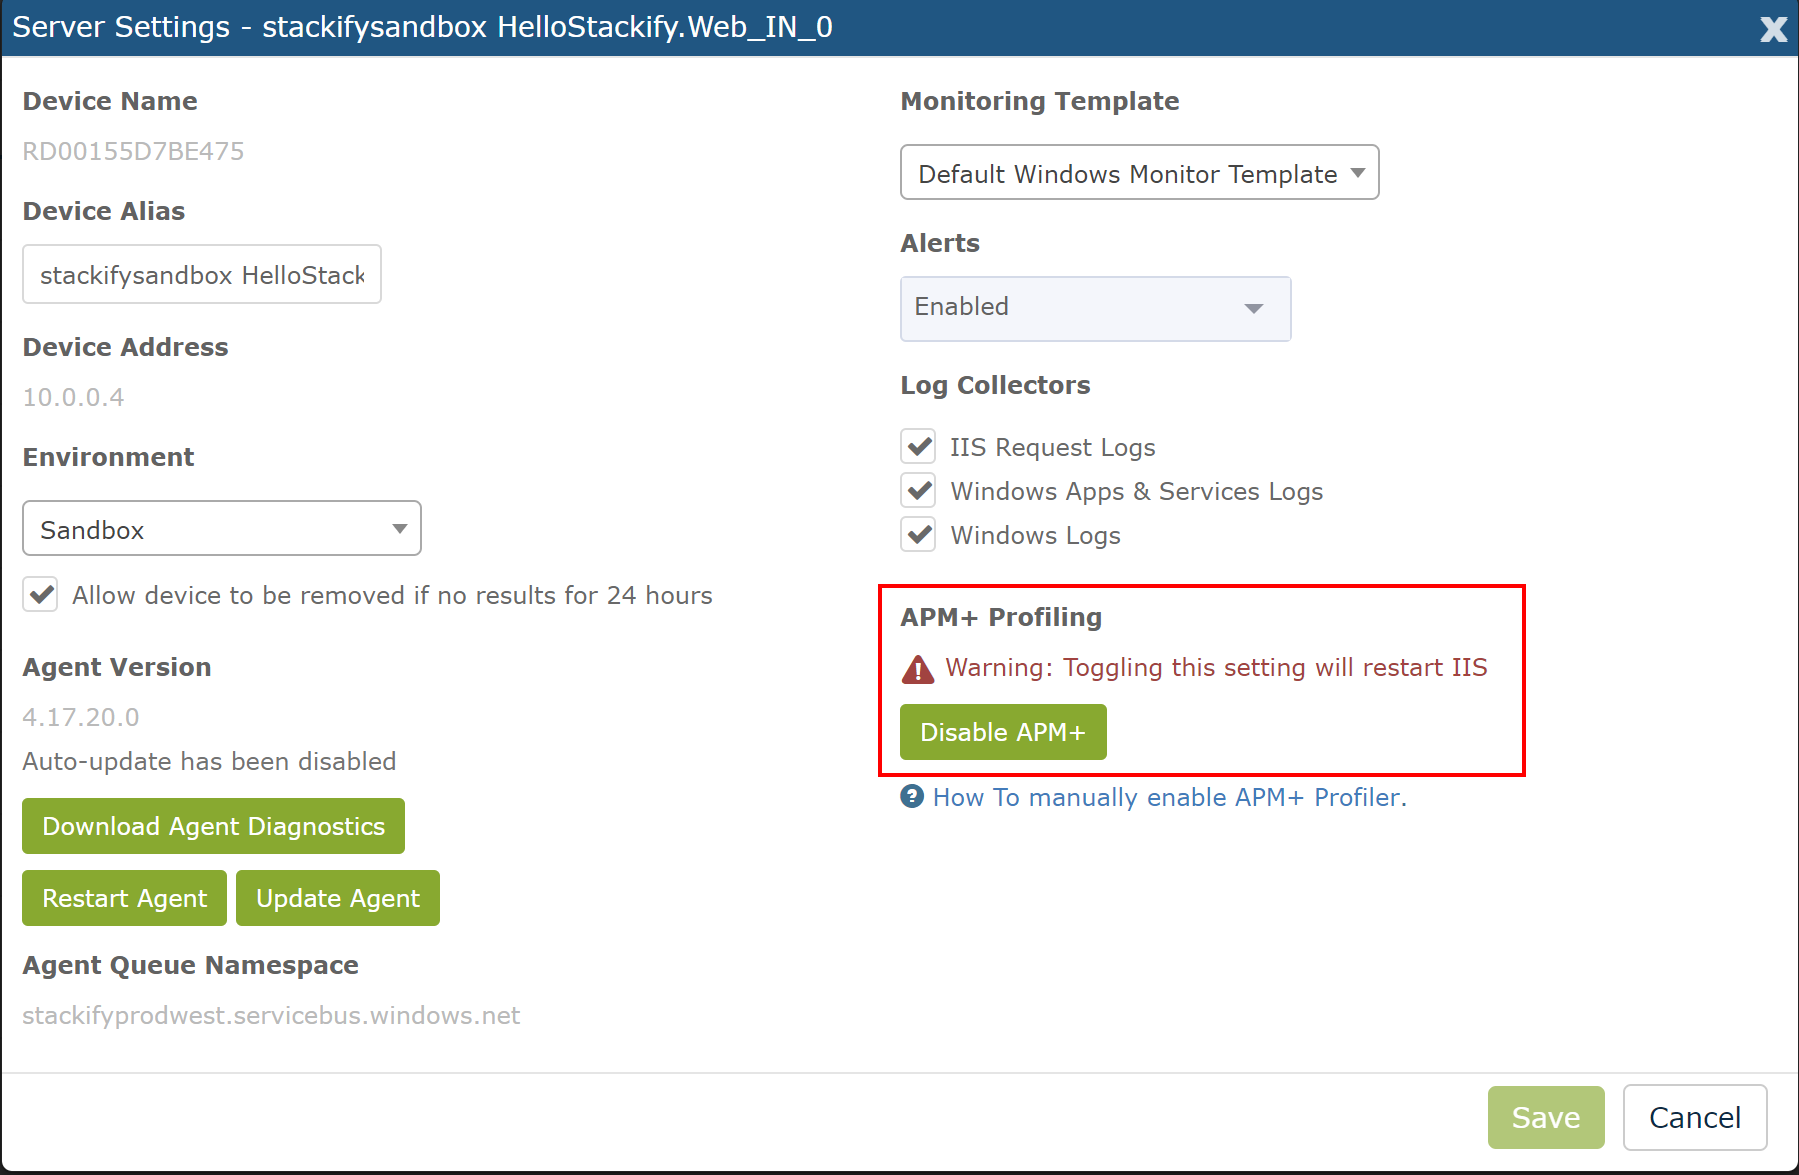
When you install the Windows agent you have the option of enabling or disabling APM. By logging in to Retrace, go to Monitoring -> Servers, and by selecting Server Settings to the right of your your server, you can enable or disable APM.
If you did not enable APM at installation, you can click Enable APM.
2. Did you Restart IIS?
Installing Retrace requires registering and installing a .NET profiler. For the profiling to take effect, you must restart IIS after the Retrace agent installation completes.
If Retrace is not collecting APM data, try restarting IIS and wait about 10 minutes to see if any data shows up.
If you are using Azure App Services, restart your app via the Azure portal.
3. Check for Stackify Agent Updates
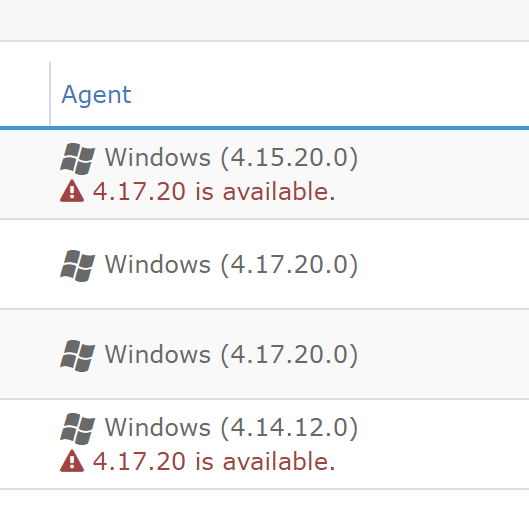
Ensure the Retrace agent is up to date. Go to Settings -> Server within Retrace. If there are newer versions available it will show you within the UI. You can install the latest version for your operating system, or easily update the the agent from the Server Settings dialog.
Is the .NET Profiler Working?
The next step is verifying if Stackify's .NET profiler is properly configured and working. We can test this by looking at the logs for Stackify's .NET profiler. This applies for Retrace and Prefix both.
Examine Profiler Logs
Anytime the Stackify .NET profiler runs, it writes a log file to a folder called Debug within the special ProgramData system folder. If the profiler is working correctly, you should see these debug files.
\ProgramData\Stackify\Agent\debug
If the profiler is collecting data, there will also be folders named by the process ID of your application. These folder contain the output of the profiler that gets processed and uploaded by the Retrace monitoring agent.
\ProgramData\Stackify\Agent\log
If the profiler appears to be attaching to your application, but no APM is showing up, here are some things to consider:
- Non web applications - These require code changes and configuration for Retrace to work. Please see this help document on how to profile .NET services.
- Is the Retrace monitoring agent stopped? Try starting it or restarting it.
- Is your license key incorrect? Review
\Program Files (x86)\Stackify\Stackify.iniand look for the setting of the ActivationKey. If your key is wrong, data would not be uploaded. This could happen if it was entered wrong or if you started a new trial and need to move the servers between accounts.
What to do if the Profiler is not Working
If the .NET profiler does not seem to be attaching to your process, here are a few common reasons:
- Profiler conflict - Retrace will not work if you also have New Relic, AppDynamics, Application Insights or other .NET profilers installed on the same machine. Only one .NET profiler can be used at a time. See more about this below.
- Non IIS application - If you are monitoring a .NET Windows Service, see our documentation on how to tell Retrace to profile your process. You must create a special configuration file to enable profiling non IIS applications.
- .NET Core - When installing Retrace you must check a specific checkbox to enable the Stackify .NET profiler. See our Windows installation directions.
- Environment variables - Ensure that the proper environment variables are being set correctly on your Windows machine. These are critical and required .NET profiling to work properly.See more about this below.
Environment variables
The following environment variables are configured by the Retrace Windows monitoring agent when APM is enabled.
Please note that the legacy profiler uses {de70e25c-02b5-4556-a837-8aa6fe502668} for the profiler ID.
The newer profiler is {cf0d821e-299b-5307-a3d8-b283c03916da}
COR_ENABLE_PROFILING=1
COR_PROFILER={cf0d821e-299b-5307-a3d8-b283c03916da}
StackifyPath=C:\Program Files (x86)\Stackify
StackifyPath should be set to the installation folder path of the Retrace agent. This is used by the .NET profiler to know where to write profiler output.
For .NET Core, these variables are also configured:
CORECLR_ENABLE_PROFILING=1
CORECLR_PROFILER={cf0d821e-299b-5307-a3d8-b283c03916da}
The easiest way to verify if these environment variables are configured is with a simple PowerShell command. Identify the process ID of your application and then run the following command:
(Get-Process -id 2640).StartInfo.EnvironmentVariables | Out-String -Stream | Select-String -Pattern COR
This will output the list of environment variables. You can then ensure the "COR" environment variables are properly set.
If the environment variables are missing, the .NET profiler will never work. You may need to restart your application. Verify that you enabled APM during installation and enable it if needed via the Retrace UI.
How to Troubleshoot the .NET Profiler Loading
When the environment variables are configured properly, .NET automatically writes to Windows Event Viewer a message that states if the profiler attached or not. This applies for Retrace and Prefix both.
Profiler was loaded
When the profiler is working successfully, you will see items that say something like the following under the source of ".NET Runtime".
.NET Runtime version 4.0.30319.0 - The profiler was loaded successfully. Profiler CLSID: '{cf0d821e-299b-5307-a3d8-b283c03916da}'. Process ID (decimal): 2640. Message ID: [0x2507].
Verify that the CLSID is cf0d821e-299b-5307-a3d8-b283c03916da which is the ID for Stackify's .NET profiler. If a different CLSID shows up, you have a conflicting profiler installed on your server. See the list below of other common class IDs to help identify the conflicting application. This is usually another APM or profiling tool.
Profiler requested not to load
You will also see many messages that says the profiler was not attached. This is normal as the profiler by design does not try to profile every .NET process on your server.
.NET Runtime version 4.0.30319.0 - The profiler has requested that the CLR instance not load the profiler into this process. Profiler CLSID: '{de70e25c-02b5-4556-a837-8aa6fe502668}'. Process ID (decimal): 3884. Message ID: [0x2516].
If it is not being loaded for your process ID and it should be, you may need to configre Retrace to profile that process. This is required for Windows Services and similar background services.
Profiler errors
If you did not get a message saying the profiler loaded or did not load with the proper CLSID, you may have some other errors. Including a CoCreate error or perhaps even crashing by w3wp.exe or your application.
- CoCreate - Another CLR profiler is competing with the Retrace profiler. Uninstall or disable any other profiler.
- w3wp.exe - If the active profiler causes problems with the w3wp service, it can cause crashes among other apps too. See a great blog post about w3wp here: 'What is w3wp.exe? Learn the Basics about IIS Worker Processes'
List of Common CLR Profiler Conflicts
The .NET profiler registers itself with a unique name/guid and only one profiler can be used at a time per server.
| Profiler Name | Profiler Identifier |
|---|---|
| App Dynamics | AppDynamics.AgentProfiler |
| AppInsights | 324F817A-7420-4E6D-B3C1-143FBED6D855 |
| Dynatrace | DA7CFC47-3E35-4c-4e-B495-534F93B28683 |
| Diagnostic Policy Service | 555908d1-a6d7-4695-8e1e-26931d2012f4 |
| IntelliTrace | 2AA1AA98-2CAA-4FCF-86CE-EFA007737E83 |
| New Relic | FF68FEB9-E58A-4B75-A2B8-90CE7D915A26 or 71DA0A04-7777-4EC6-9643-7D28B46A8A41 |
| Ruxit | B7038F67-52FC-4DA2-AB02-969B3C1EDA03 |
| SCOM APM | AD5651A8-B5C8-46ca-A11B-E82AEC2B8E78 |
| OpenTelemetry | {918728DD-259F-4A6A-AC2B-B85E1B658318} |
Seeing “Loading this assembly would produce a different grant set from other instances”
To resolve:
- Stop the
Stackify Monitoring Serviceon the server - Locate your
Stackify.jsonfile for the application(s) on the server you are installing Retrace on. - Add the following to the file(s):
Property:
“EnableNonGACSupport”: true
Environment Variable:
COMPLUS_LoaderOptimization=1 - Running as an Admin, perform an
iisresetusing the command line or powershell - Start the
Stackify Monitoring Service - Test your application again
Other Common Issues
- Classic application pool mode - If you are running your app pool in Classic mode, there are additional steps. Please read the following document: .NET Agent Installation: Enable Classic IIS App Pools.
- .NET Runtime version - Retrace supports both .NET 2.0 and .NET 4.0 runtime versions, but if you're using .NET 2.0, some minor configuration changes are required. Please read the following: .NET Agent Installation: Advanced Topics.