If you haven't configured RUM for your application already, please view the RUM Getting Started docs.
Viewing RUM Data
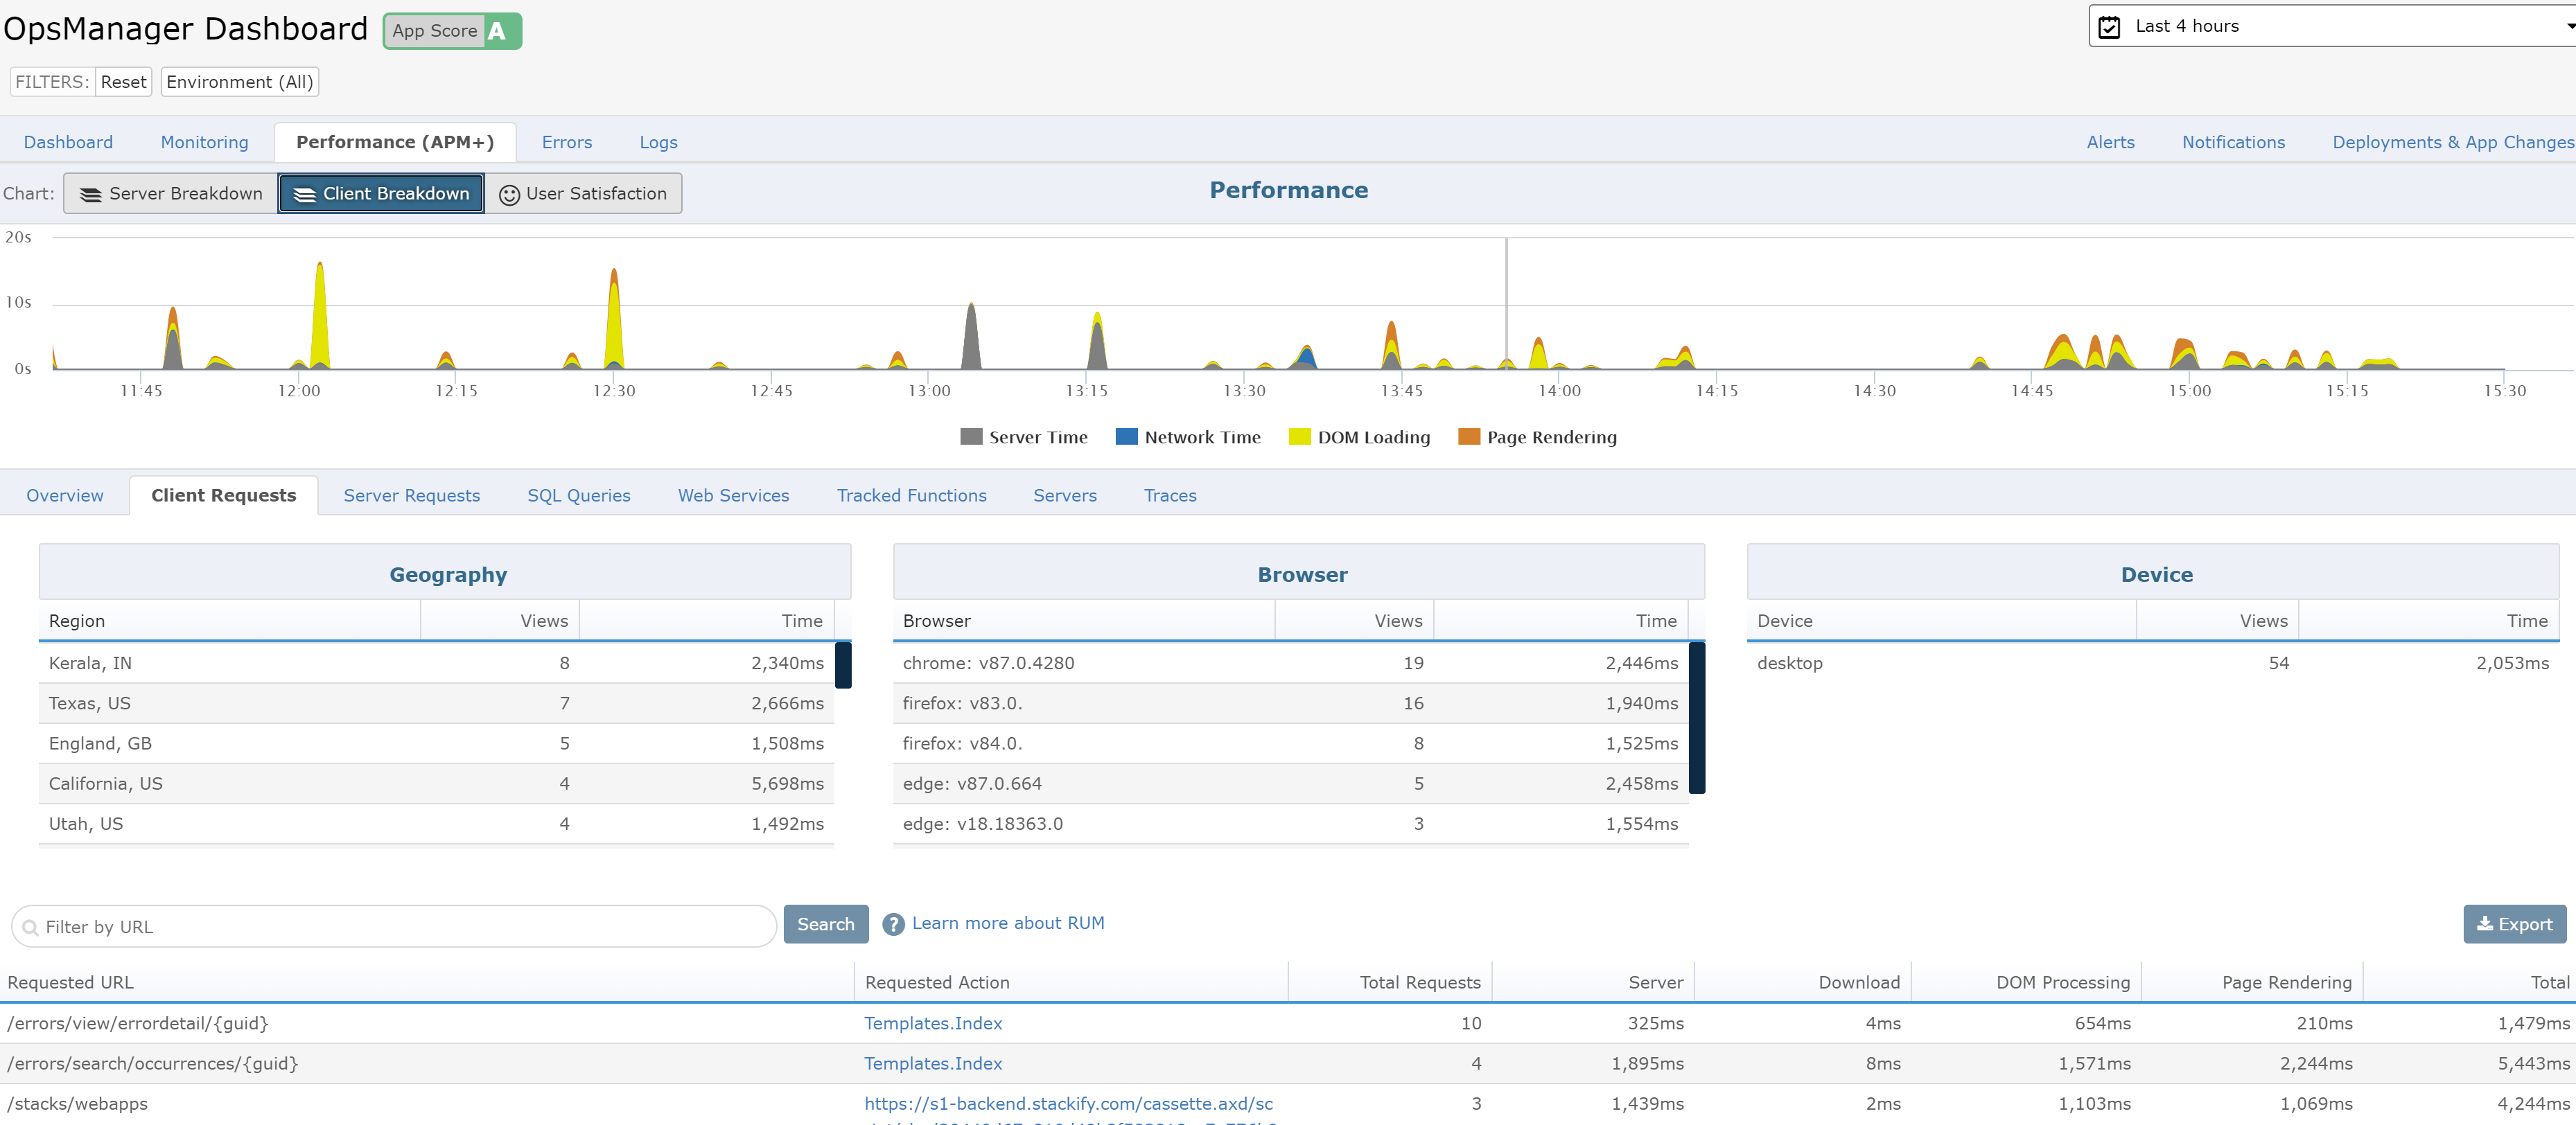
To view RUM data being collected from your application, click on the application name of the Apps page to view the app dashboard and then click on "Performance (APM+)". Here you will see an overview of your app's performance.
The Client Requests Tab
To see RUM data, click on the "Client Requests" tab. On this tab you will see a collection of requests that represent the client-side page views for your app in a given time range.
You will also be able to view segmented user data broken up by Geography, Browser, and Device of your application requests.
Viewing RUM Traces
The Traces Tab
In the Performance section of the app dashboard there is a Traces tab. This tab displays a table of all the application's traces for the selected timerange. On this page you can view all of your RUM traces by clicking on the RUM Traces filter button next to the search bar. You can also sort your traces by the Client Time column to see which traces are taking the longest. Clicking on the Url or the View button of a trace will take you to the Performance Modal.
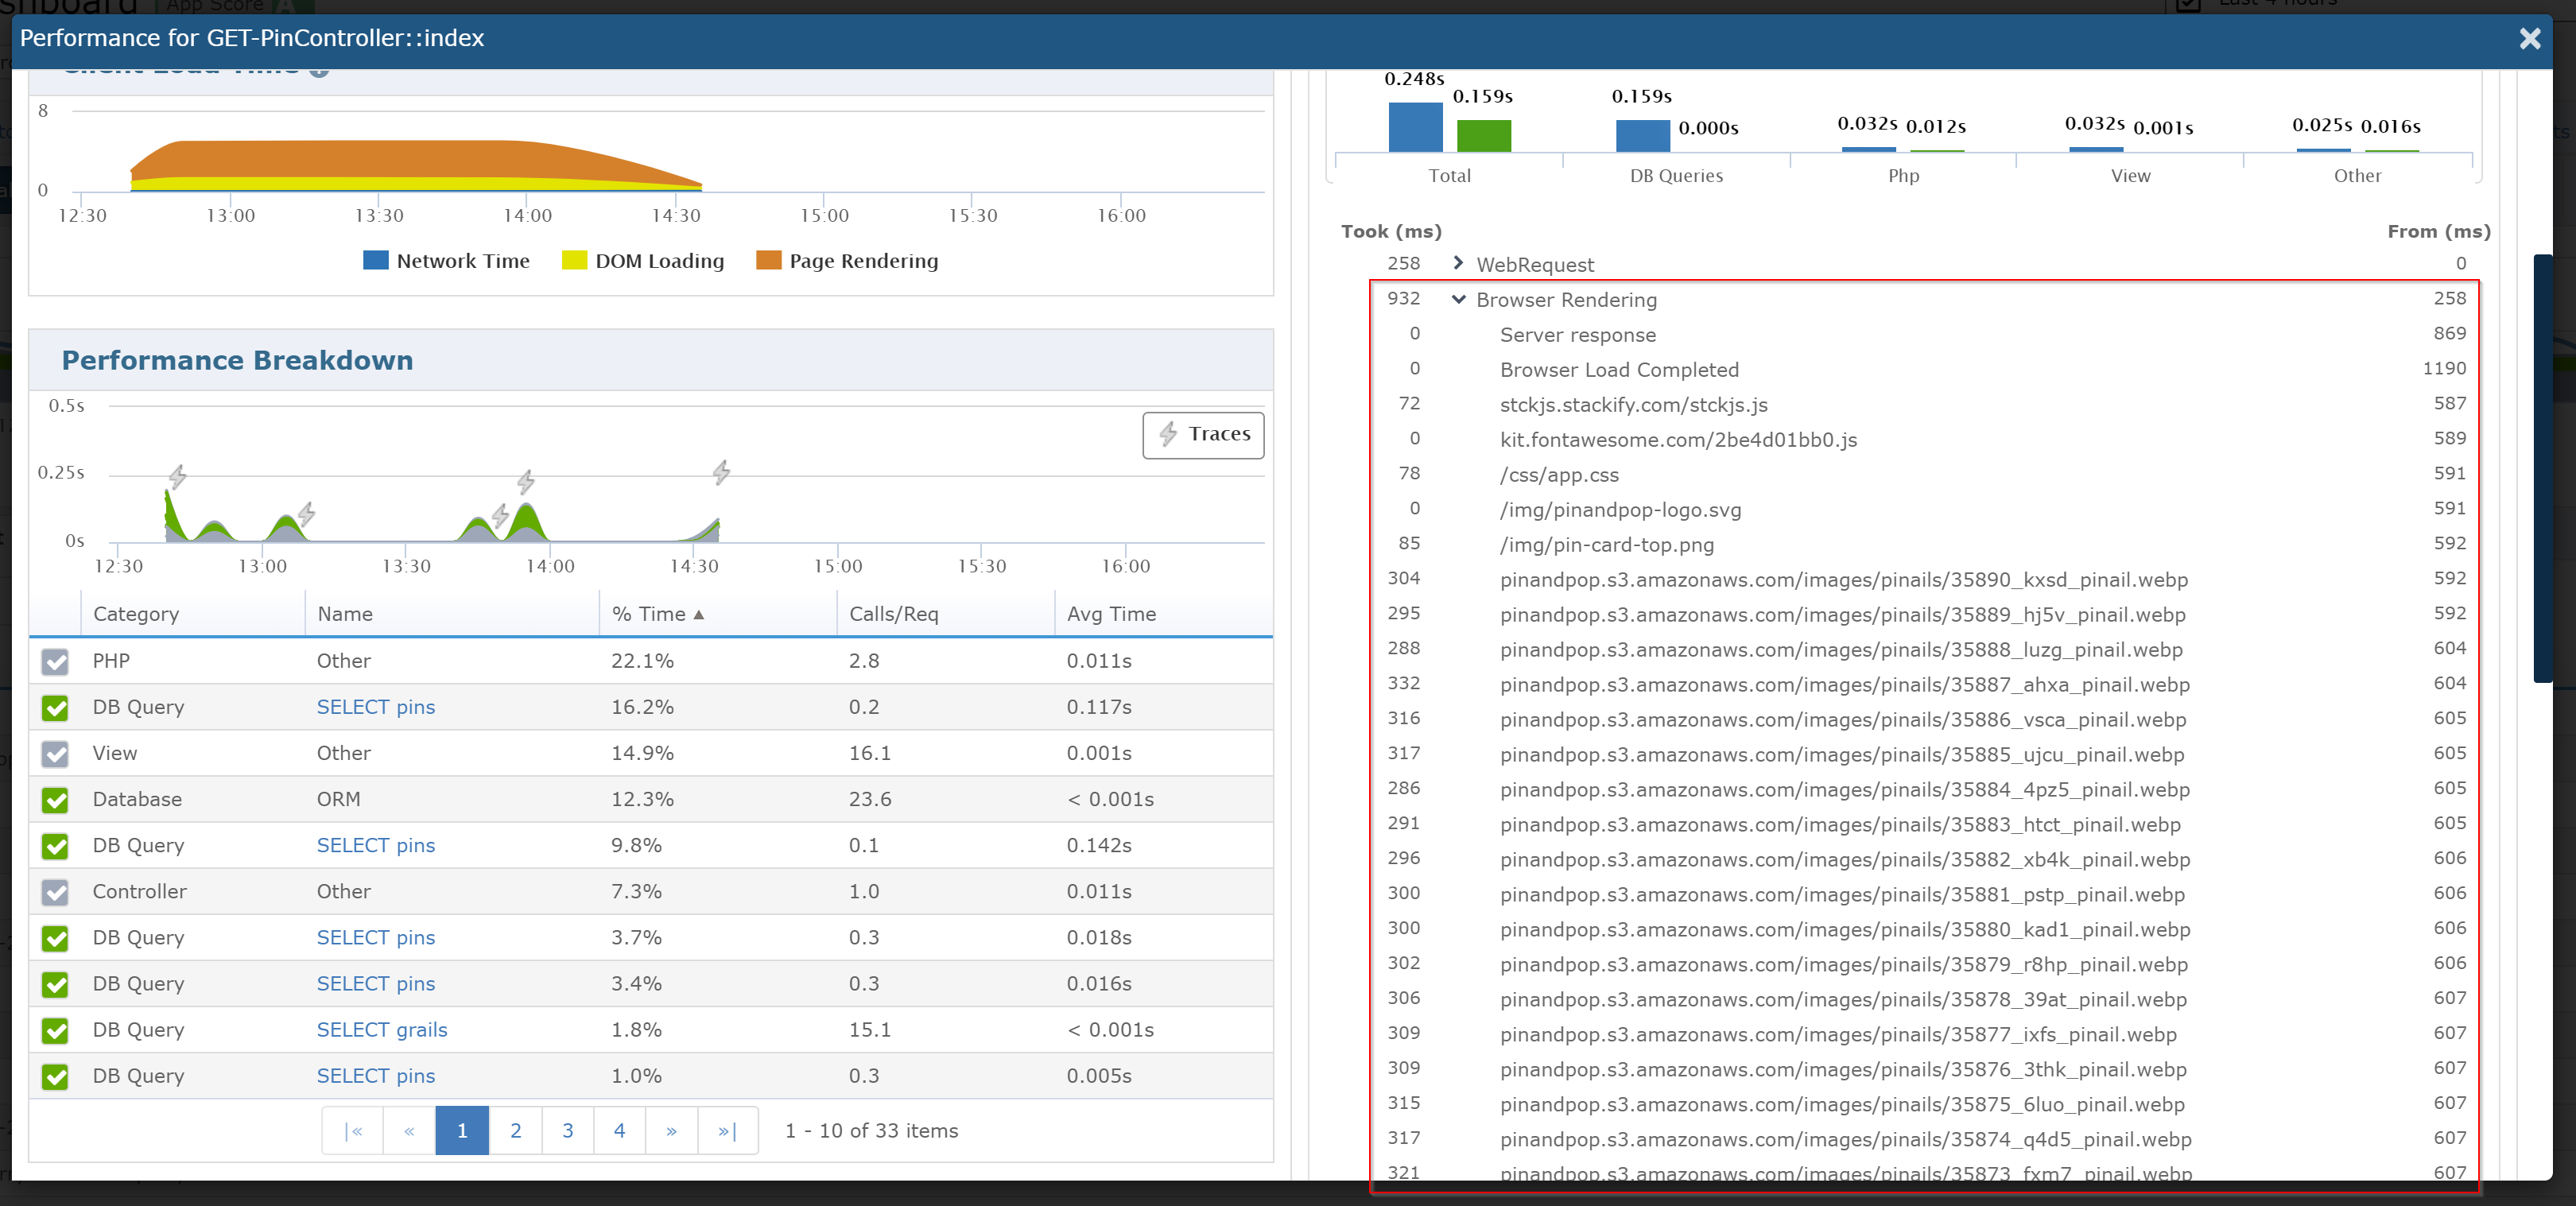
The Performance Modal
To view the client-side trace details of a request, simply click on the Requested Action link of the request you wish to view. This will open a modal that has additional information specific to that request. The trace breakdown section by default will show the slowest trace for a given endpoint. In this breakdown you will be able to view a Browser Rendering section that will contain browser resources being loaded for the trace.