The Legacy .NET Profiler
This documentation is for Stackify's legacy .NET profiler. We recommend using our new .NET profiler unless you are using a .NET 3.5, 4.0, 4.5.0 or 4.5.1 application that can not use the new profiler. .Net 4.5.2 applications are supported in the new profiler if the .Net 4.6 framework is used to run the application. The new profiler must be used for all .Net Core 3.1 and later applications (including .Net 5.0 and 6.0).
New Stackify customers after December 2020 are using the new profiler by default. All previous customers must manually switch to the new profiler. Please contact our support team to change to use the new profiler by default. You can manually change it by following the documentation here.
For our new profiler please go to our getting started documentation.
Supported Technologies
Enabling the Legacy Profiler
Disabling the Legacy Profiler
Setting up .NET Core
Profiling Windows Services
Custom Instrumentation
Troubleshooting APM Issues in the Legacy Profiler
Supported Technologies
The following frameworks are automatically supported by Retrace and the legacy .NET APM profiler. The profiler traces will include details from these libraries with no additional configuration. Please note that most async functions are supported in the following libraries as well. To see what is supported in the Default Profiler see Supported .NET Technologies for the V2 Profiler.
Application Types
- ASP.NET
- ASP.NET Core (for versions 2.0 or older)
- Windows Services
- Azure WebJobs
UI Frameworks
- WebForms
- MVC
- Web API
- WCF
- Nancy
- ServiceStack
- Owin
Databases
Most ORM solutions like Entity Framework, NHibernate, Dapper, and Linq2SQL are supported.
- SQL Server
- MySql (MySql.Data.MySqlClient)
- Oracle (Oracle.ManagedDataAccess & System.Data.OracleClient)
- Postgres (Npgsql)
- SQL Server CE
- ODBC via OdbcCommand
Storage/NoSQL
- MongoDB
- Elasticsearch
- RavenDB
- Azure libraries (see below)
- AWS libraries (see below)
Cache
- Redis (ServiceStack & StackExchange)
- memcached (enyim)
- AppFabric & Azure Cache (Microsoft cache)
Queues
- Azure Service Bus
- Azure Storage Queue
- MSMQ
- NServiceBus
Web Requests
- Low level HttpWebRequest/HttpWebResponse
- WebClient
- HttpClient
- RestSharp
- Auto-generated WCF proxy clients
- Plus others from libraries that use HTTP within them like Elasticsearch, Azure storage, etc.
Azure
- SQL Azure
- Storage (Blogs, Queues, Tables)
- Document DB
- Azure Service Bus
- Caching (via Redis & AppFabric support)
AWS
- S3
- SimpleDB
- SimpleEmail
- SimpleNotificationService (SNS)
- SimpleWorkflow
- SQS
- ElastiCache (via memcached & redis support)
- CloudSearch
- Redshift
- ElasticMapReduce
- ElasticTranscoder
- Glacier
Other
Retrace also tracks and shows times for some other various activities
- Estimated compilation time
- HTTP Modules
- Reading incoming HTTP post data and deserializing requests
- Serializing and sending HTTP responses
- Request queuing
Please also note that things like compilation, GC pauses, JIT time, IIS queuing and other things can also take time in your code and may not be reflected by Retrace.
Enabling the Legacy Profiler
Prerequisite
Make sure that the Windows Retrace Monitoring Agent is installed on your host:
Physical or Virtual Machines
Once the Retrace Window Agent is installed, enabling the profiler is straight forward:
-
If necessary, stop any applications that are currently being profiled by the default .NET profiler (including IIS if Web Applications are being profiled)
-
Edit
C:\Program Files (x86)\Stackify\Stackify.iniand add this setting to the[Feature]section:
LegacyProfiler=1
- Restart the service:
Stackify Monitoring Service - Restart any applications (and/or IIS) that you wish to be profiled
Azure App Services
Azure App Service requires configuration changes to enable the new profiler depending on whether your application is .NET Core or .Net Framework 4.x.
Support for .Net Framework applications in Azure App Services is limited to non-shared pricing plans.
- In the Configuration section of your Azure App Service, add a new Application Setting
LEGACYPROFILERand set its value totrue - Save configuration settings which will restart your application
Disabling the Legacy Profiler
In the event you want to disable Retrace's .NET profiler and APM features on a server, but want to continue monitoring the server and the apps on it without profiling, just follow these simple steps.
Disabling via Server Settings
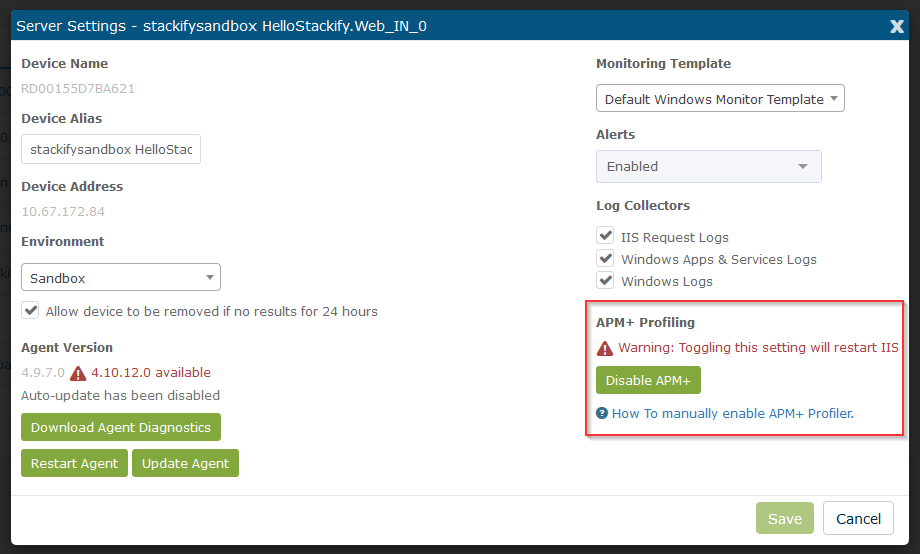
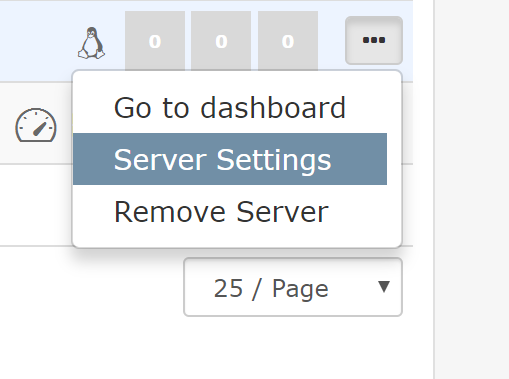
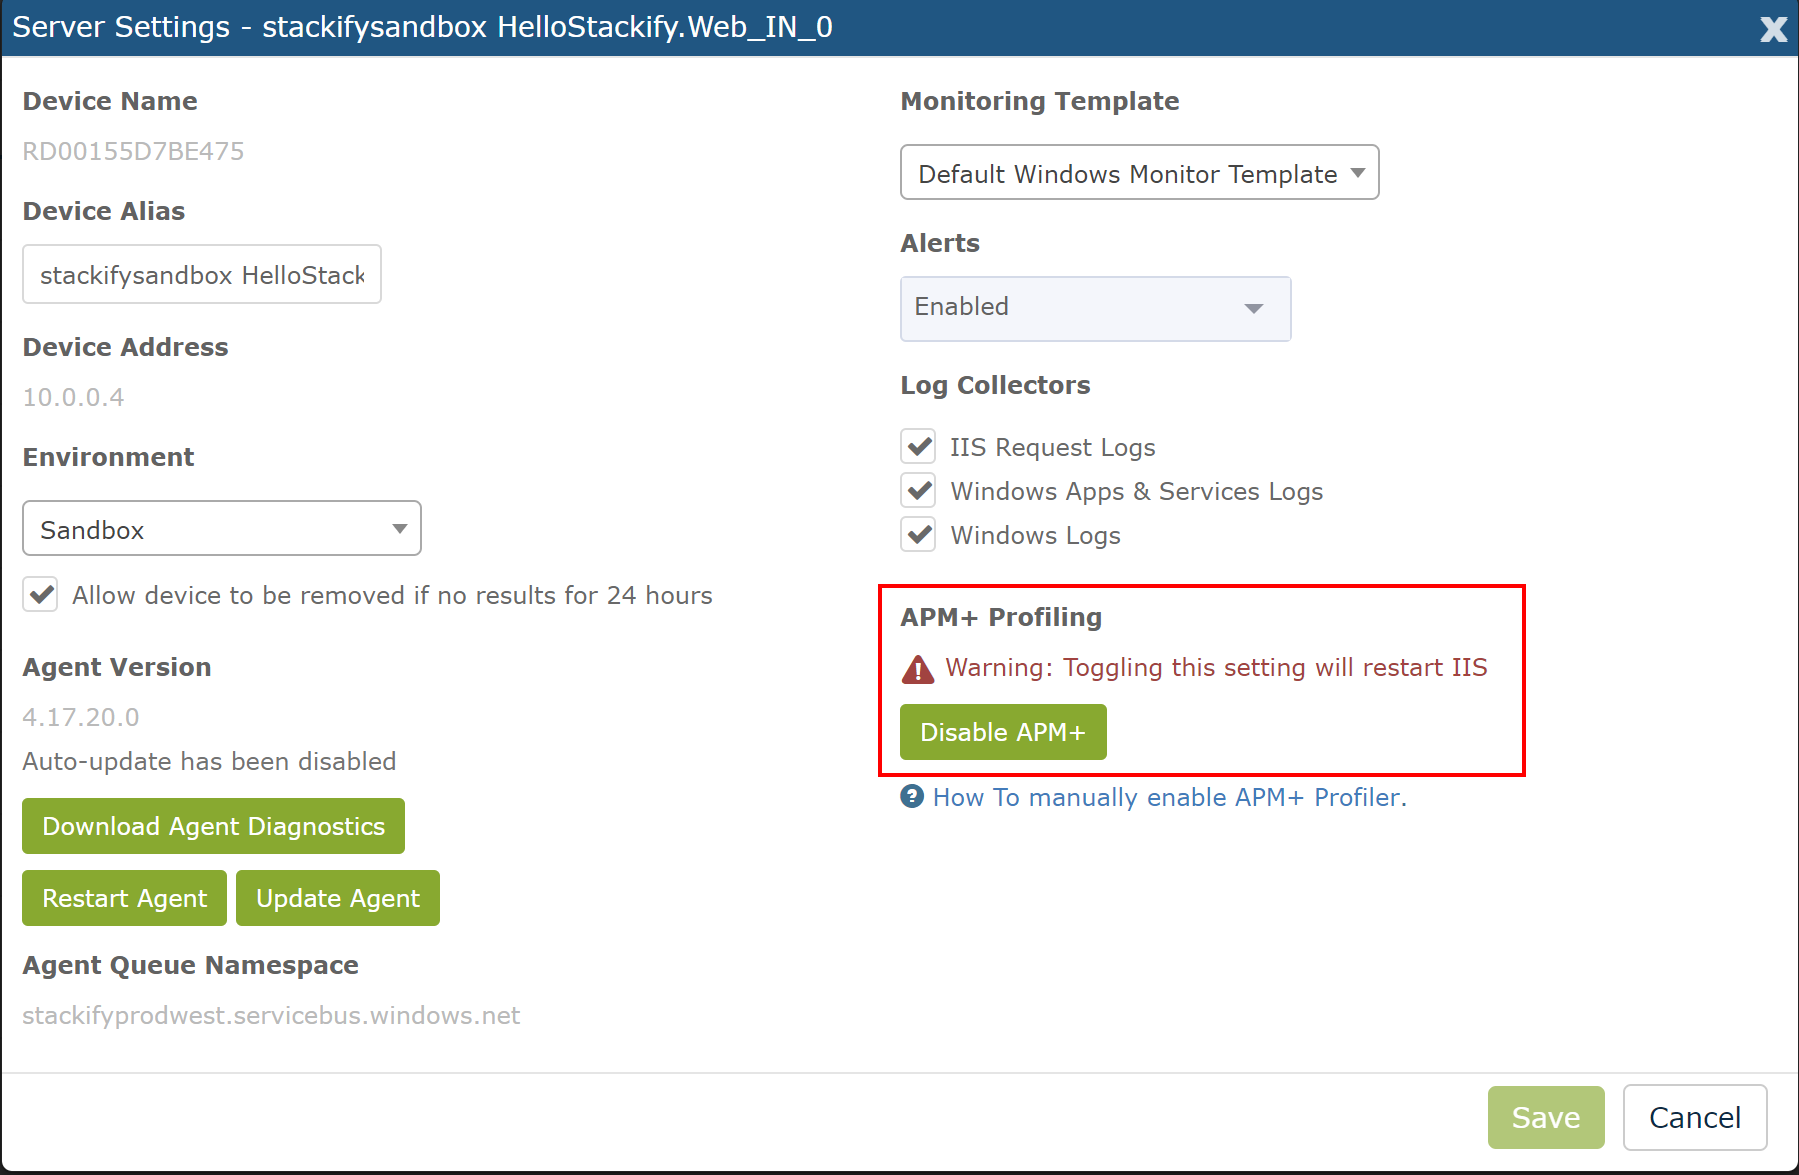
First go to Server Settings for the server that is running APM that you wish to disable.
Simply click the Disable APM button to disable APM and to restart IIS. Once IIS restarts, it will no longer have the Retrace APM Profiler attached and you will stop seeing APM data in your application dashboard.
Disabling the Profiler Manually
While we don't recommend this as your normal course of action, if you need to disable the profiler manually rather than through the UI, take the following actions on your server:
- Stop IIS
- Delete or rename the profiler DLL found at:
[Install Drive]:Program Files (x86)\Stackify\Profiler\[x64 or x86]\StackifyProfiler_[x64 or x86].dll
- Restart IIS
The CLR will still attempt to load the profiler and immediately fail, but will continue to load your app and run it as normal, without profiling. This event will be logged to the Windows Event Viewer.
Switching from the Legacy Profiler to the Default Profiler
In the event that you want to use the default .NET APM Profiler instead of the Legacy profiler, follow these steps:
- Make sure you are updated to agent version 4.29.29 or later.
- Stop any applications that are currently being profiled by the Legacy .NET profiler (including IIS if Web Applications are being profiled)
- Make the following edits to the
C:\Program Files (x86)\Stackify\Stackify.inifile:
- Remove this setting to the
[Feature]section:
LegacyProfiler=1
- Add in this setting to the
[Feature]section:
NEWPROFILER=1
- Restart the service:
Stackify Monitoring Service - Restart any applications (and/or IIS) that you wish to be profiled
Setting up .NET Core
Retrace has been tested with .NET Core apps targeting the full .NET framework as well as the new .NET Core "netcoreapp" framework. It works with ASP.NET Core apps that are deployed behind IIS.
There are potentially 2 different types of .NET Core applications:
- ASP.NET Core app that is hosted with/behind IIS
- A console app or Windows service that is not a web app
The Retrace profiler and agent should automatically profile and track ASP.NET Core apps hosted with IIS.
- Add the "StackifyMiddleware" nuget package to your project.
PM> Install-Package StackifyMiddleware
- Modify your Configure() method in Startup.cs to add our middleware. The order in which you add middleware in your code matters. The StackifyMiddleware must be added before app.UseExceptionHandler().
app.UseMiddleware<StackifyMiddleware.RequestTracerMiddleware>();
Profiling Windows Services
By default Retrace only profiles applications hosted within IIS. If you want Retrace to capture transactions from an application running as a Windows service, please follow these directions.
Retrace supports multiple types of .NET background services. Please review their installation guides for more details.
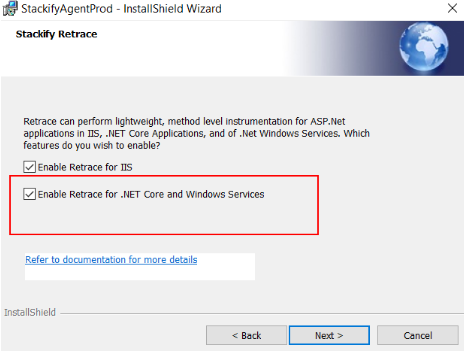
Step 1. Install Retrace Windows Agent with the option for Windows Services with one of the below options:
Option 1. New install in interactive mode:
Upon installing check the box for Enabling the Retrace for .NET Core and Windows Services.
Option 2. New install via command line, for example:
"Stackify_[version].exe" /s /v"ACTIVATIONKEY=YOUR_KEY_HERE ENVIRONMENT="ENTER_ENVIRONMENT_HERE" ENABLEPROFILER=1
Note: set RestartIIS=1 if you wish to have Retrace automatically restart IIS to begin profiling of web apps.
Option 3. For an existing install of Stackify
- Modify [Install Drive]:Program Files (x86)\Stackify\Stackify.ini
- Add AttachAll=1 to the [FEATURES] section
- Restart the “Stackify Monitoring Service” Windows Service
Step 2. Tell Retrace which services to profile with one of the below options
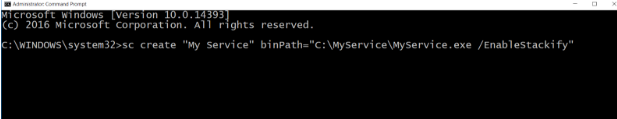
Option 1. By using the “/EnableStackify” switch For an existing service, double check what the existing path is via the UI or by the command line “sc query” commands. Copy this path so you can use it via command line to update it.
You can then update the path via command line and add our command line switch to it like so:
CMD> sc config “My Service” binPath=”c:pathapp.exe /EnableStackify”
When you create your service, you may also provide this switch with the executable. For example, to install your service from a command prompt:
Option 2. By creating a “ProfileProcess.txt” file
This is a JSON formatted file that can define one or many EXEs to profile
[{"exe": "MyService.exe"},
{"exe": "MyService1.exe"},
{"exe": "SuperDuperService.exe"}]
You may save this file:
- In the same folder as the .exe that is being profiled. This would allow you to easily “bin deploy” the file with your app.
- Into [Install Drive]:Program Files (x86)\Stackify
If you are running into issues around the .txt file getting parsed correctly, please ensure that the file is saved as UTF-8 encoding.
Step 3. Restart your service
After creating the ProfileProcess.txt you will need to restart your Windows Ser
Step 4. Define a transaction for Retrace
At this point, Retrace will begin profiling your code, and capture some data such as exceptions and errors, but to track a transaction through the app, you must add some instrumentation to your app via our library. Depending on the type of application, there are multiple ways to do this. To learn more and see examples, please see the Tracking Custom Transactions section of Custom Instrumentation below.
Custom Instrumentation
By default, Retrace automatically profiles a wide range of common .NET technologies, including multiple ASP.NET frameworks, database libraries, HTTP services, and much more.
Retrace also supports multiple ways to customize what data is collected. View the types of instrumentation below to learn how to implement it for .NET applications.
- Profiling Methods in Your Code - Customize our .NET profiler to track methods in your code.
- Tracking Custom Transactions - Define a scope of code in your code that should be tracked by Retrace as a unique transaction. This is required for background services like Windows Services, WebJobs, Azure Worker Roles, etc.
- Tracked Functions - Useful for tracking sub-transactions like when a specific thing happens within your code.
Profiling Methods in Your Code
One of the key benefits of the profiler is that you may instrument tracing of how long any .NET method takes to execute and include that output in the call stack.
In deciding what to profile, keep in mind the overhead that could be incurred. For example, if you choose to use a wildcard configuration as described below, all .NET properties that have Get and Set accessors (which includes dynamic properties) will be profiled via these accessors, and can be quite high in volume.
Advanced Custom Configuration
Note: This section describes how to customize the Retrace .NET Profiler to add instrumentation. Any changes made to the configuration file must be formatted properly at the risk of causing instability.
To add custom configuration:
- Create a configuration file named ProfileClientConfig.txt per the format described below.
- Save to your installation folder ([Install Drive]:\Program Files (x86)\Stackify\ProfileClientConfig.txt).
In the ProfileClientConfig.txt configuration file you created, you will need to create a JSON format document that allows you to specify methods you wish to profile. The document follows this format:
[{
	"Class": "MyNamespace.MyClass",
	"Method": "MyMethod"
},
{
	"Class": "MyNamespace.MyClass2",
	"Method": "MyMethod"
}]
A wildcard of “*” may be used for both Class and Method properties. It is not recommended to use the wildcard character for a namespace, as that will key the profiler to instrument every single .NET method call. Please note that every tracked method adds overhead to your application and will slow it down slightly. Adding a few methods picked up per web request is no big deal, however, a wildcard for something like System.Data.* is a bad idea and could crash your application. Valid options are:
[{
	"Class": "MyNamespace.MyClass",
	"Method": "*"
},
{
	"Class": "MyNamespace.*",
	"Method": "*"
}]
Please ensure to follow proper JSON document formatting. Incorrect formatting will prevent the profiler from starting. Once the ProfileClientConfig.txt file is created, be sure to save the file and recycle the IIS application pool for your app.
It is also important to know that the namespaces and method names may vary from what you think they are. The actual method names used by CLR vary due to things like interfaces, private classes, compilation optimization and call tailing.
Configuring Azure App Services & WebJobs
- The process is the same for Azure App Services, just be sure to include the ProfileClientConfig.txt file in the bin folder when you deploy your app.
- The process for Azure WebJobs is to include the ProfileClientConfig.txt file in the same folder as the .exe that is being profiled.
For continuous web jobs:
D:\home\site\wwwroot\app_data\jobs\continuous\\[MyWebJob]\ProfileClientConfig.txt
For triggered web jobs:
D:\home\site\wwwroot\app_data\jobs\triggered\\[MyWebJob]\ProfileClientConfig.txt
Tracking Custom Transactions
By default Retrace only tracks web transactions, however, it can be used to track non web transactions with some minor code changes. This article discusses tracking non web requests and could be applied to background work within a web app, a windows service, console app, or other types of service apps.
You must first configure Retrace to know about and profile your application. By default Retrace only profiles IIS applications. Please review this article on how to tell it to profile your application: Enabling Retrace for non IIS applications
How it works
Tracking custom transactions is done by using the ProfilerTracer object within StackifyLib. This creates a defined operation from start to finish that can be named and tracked as a single operation. Here is a simple code example:
//Create a new ID for the operation for correlation
  Trace.CorrelationManager.ActivityId = Guid.NewGuid();  //name the operation whatever you want
  var tracer = StackifyLib.ProfileTracer.CreateAsOperation("Operation Name", Trace.CorrelationManager.ActivityId.ToString());

  tracer.Exec(() =>   //FYI, async code is also supported via tracer.ExecAsync()
  {
      //Do some stuff here
  });
Key considerations and potential problems
Retrace is designed to track individual transactions, so the transactions should be fairly short in length. If your application has a very long running thread in a loop that never finishes, it is possible that this collection of data could grow continually and use a lot of memory. A good example would be a section of code that is in a never ending loop that runs database queries. You can also prevent this in your own code by using our ProfileTracer object and creating operations. (ProfileTracer.CreateAsOperation) Anytime one of those operations ends, that section of collected data will be processed. If you are having problems getting profiling of a Windows Service to work correctly, feel free to reach out to our support team and will try to help.
What can you track?
Retrace is great for web apps or background apps that do the same "transaction" continually. It isn't designed to track clicks in a desktop application. You can track events that run on a timer, events and more.
You can also enable Retrace for self hosted WCF and Web API apps.
Job Scheduler like Quartz We automatically track some key methods around Quartz jobs so you don't need to StackifyLib.ProfileTracer for Quartz to define the scope of the operations. Instead, you only need to name the jobs by calling SetOperationName, otherwise we will show them all as "Quartz". We also recommend setting the CorrelationManager as shown below. The below code example shows creating a base class that all of your jobs can use so you can put the code in a single place.
using System.Diagnostics;
using Quartz;
using System;

namespace Stackify.JobScheduler
{
    public abstract class BaseJob : IJob
    {
        //method the job needs to implement
        public abstract void ExecuteJob(IJobExecutionContext context);

        public void Execute(IJobExecutionContext context)
        {
            Trace.CorrelationManager.ActivityId = Guid.NewGuid(); //unique id for operation
            StackifyLib.ProfileTracer.SetOperationName("Job-" + this.GetType().Name);
            this.ExecuteJob(context);
        }
    }
}
Processing queue messages
Processing messages off a queue is a perfect example where it makes sense to use a profiler. Retrace keeps your queue processing from being a black box that you have no visibility into. Below are code examples for using our ProfilerTracer with async code to process messages off a Azure Service Bus message pump.
//Pseudo example of code that processes messages of a queue with async

  var options = new OnMessageOptions
  {
      MaxConcurrentCalls = 5,
      AutoComplete = false
  };
  MessagingFactory messagingFactory = null;
  string queue = "";
  QueueClient client = messagingFactory.CreateQueueClient(queue, ReceiveMode.PeekLock);
  client.OnMessageAsync(async m =>
  {
      bool shouldAbandon = false;
      try
      {
          //Create a new ID for the operation for correlation
          Trace.CorrelationManager.ActivityId = Guid.NewGuid();

          //name the operation whatever you want, probably the queue name in this example
          var tracer2 = ProfileTracer.CreateAsOperation("Operation Name",Trace.CorrelationManager.ActivityId.ToString());

          //wrap your code in the ProfileTrace operation
          await tracer2.ExecAsync(() =>
          {
              return ProcessMessageAsync(m);
          });


          // complete if successful processing
          await m.CompleteAsync();
      }
      catch (Exception ex)
      {
          shouldAbandon = true;
          Console.WriteLine(ex);
      }

      if (shouldAbandon)
      {
          await m.AbandonAsync();
      }
  },
  options);
Other event based transactions
There are a lot of scenarios of event based or scheduled services that could be tracked by Retrace. We have already covered a couple common ones like listening to a queue, or using a job scheduler like Quartz. However, there are many other types as well. Some other examples:
- An app that waits for files to be dropped in a folder
- An app that utilizes some sort of custom sockets
- An SMTP mail server
- Azure Service Bus Relay
Tracked Functions
Tracked functions are used to track sub-transactions within a web request or custom transaction. This is useful for tracking something like a specific Elasticsearch query or any logic within your application.
Custom transactions define the larger operation to be tracked. Tracked functions allow you to track a small part of that large transaction.
Learn more about Tracked Functions
To utilize Tracked Functions, you must add our StackifyLib nuget package to your project. You then surround your code as shown below with our tracer.
var tracer = StackifyLib.ProfileTracer.CreateAsTrackedFunction("Name the block of code");
tracer.Exec(() =>
{
   //Do some stuff
});
Troubleshooting APM Issues in the Legacy Profiler
This guide is intended to help users who are experiencing problems trying to configure their application to send APM data to Retrace. If you haven’t already, check out our documentation on installing Retrace for your appropriate application framework.
If you are using Azure App Services, Elastic Beanstalk, or other deployment models, those installation guides may provide additional troubleshooting details.
This guide is designed for Retrace, although many of the troubleshooting steps also apply for Prefix. If you are having problems with Prefix, please also see our troubleshooting guide for Prefix.
Verifying Retrace Installation Basics
If you are having problems with Retrace APM not working, the issue is most likely something very simple.
1. Is APM enabled?
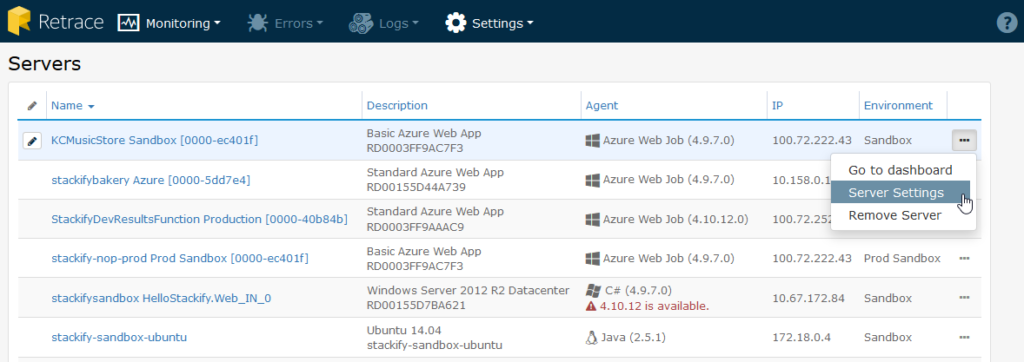
When you install the Windows agent you have the option of enabling or disabling APM. By logging in to Retrace, go to Monitoring -> Servers, and by selecting Server Settings to the right of your server, you can enable or disable APM.
If you did not enable APM at installation, you can click Enable APM.
2. Did you Restart IIS?
Installing Retrace requires registering and installing a .NET profiler. For the profiling to take effect, you must restart IIS after the Retrace agent installation completes.
If Retrace is not collecting APM data, try restarting IIS and wait about 10 minutes to see if any data shows up.
If you are using Azure App Services, restart your app via the Azure portal.
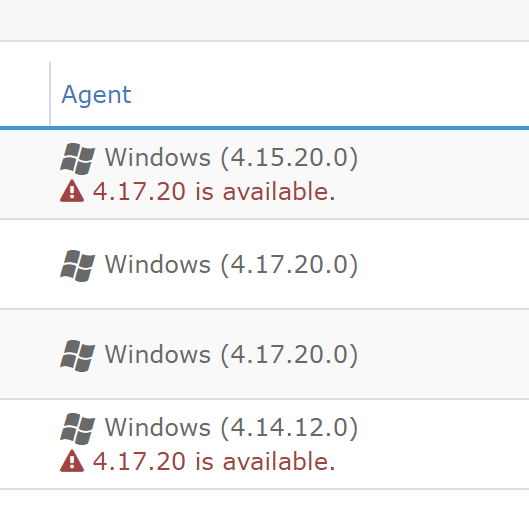
3. Check for Stackify Agent Updates
Ensure the Retrace agent is up to date. Go to Settings -> Server within Retrace. If there are newer versions available it will show you within the UI. You can install the latest version for your operating system, or easily update the agent from the Server Settings dialog.
Is the .NET Profiler Working?
The next step is verifying if Stackify's .NET profiler is properly configured and working. We can test this by looking at the logs for Stackify's .NET profiler. This applies for Retrace and Prefix both.
Examine Profiler Logs
Anytime the Stackify .NET profiler runs, it writes a log file to a folder called Debug within the installation folder. If the profiler is working correctly, you should see these debug files.
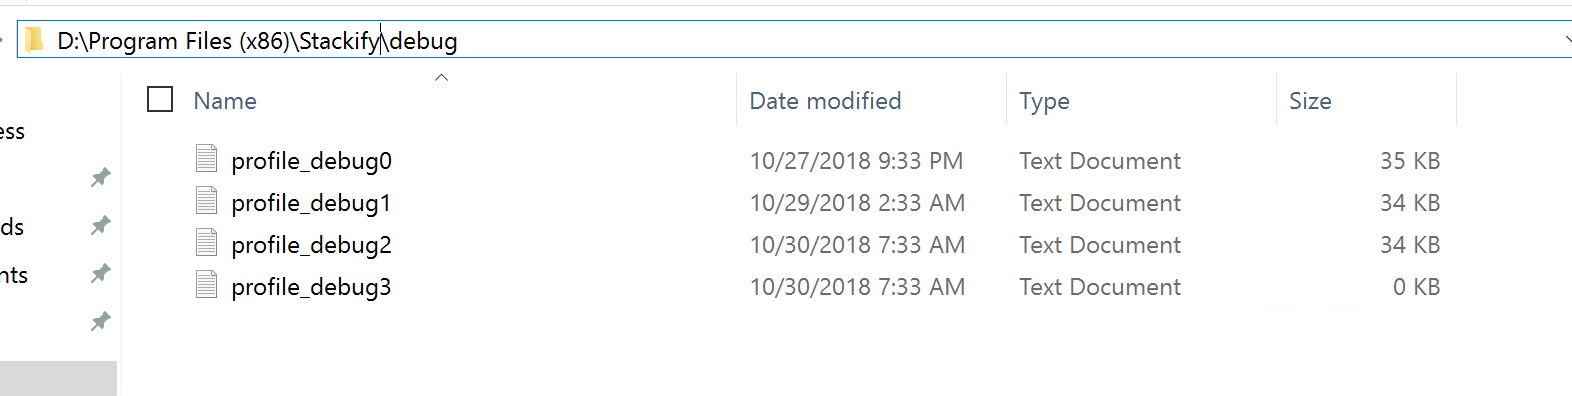
If the profiler is collecting data, there will also be folders named by the process ID of your application. These folders contain the output of the profiler that gets processed and uploaded by the Retrace monitoring agent.
If the profiler appears to be attaching to your application, but no APM is showing up, here are some things to consider:
- Non web applications - These require code changes and configuration for Retrace to work. Please see this help document on how to profile .NET services.
- Is the Retrace monitoring agent stopped? Try starting it or restarting it.
- Is your license key incorrect? Review
\Program Files (x86)\Stackify\Stackify.iniand look for the setting of the ActivationKey. If your key is wrong, data would not be uploaded. This could happen if it was entered wrong or if you started a new trial and need to move the servers between accounts.
What to do if the Profiler is not Working
If the .NET profiler does not seem to be attaching to your process, here are a few common reasons:
- Profiler conflict - Retrace will not work if you also have New Relic, AppDynamics, Application Insights or other .NET profilers installed on the same machine. Only one .NET profiler can be used at a time. See more about this below.
- Non IIS application - If you are monitoring a .NET Windows Service, see our documentation on how to tell Retrace to profile your process. You must create a special configuration file to enable profiling non IIS applications.
- .NET Core - When installing Retrace you must check a specific checkbox to enable the Stackify .NET profiler. See our Windows installation directions.
- Environment variables - Ensure that the proper environment variables are being set correctly on your Windows machine. These are critical and required .NET profiling to work properly.See more about this below.
Environment variables
The following environment variables are configured by the Retrace Windows monitoring agent when APM is enabled.
COR_ENABLE_PROFILING=1
COR_PROFILER={de70e25c-02b5-4556-a837-8aa6fe502668}
StackifyPath=C:\Program Files (x86)\Stackify
StackifyPath should be set to the installation folder path of the Retrace agent. This is used by the .NET profiler to know where to write profiler output.
For .NET Core, these variables are also configured:
CORECLR_ENABLE_PROFILING=1
CORECLR_PROFILER={de70e25c-02b5-4556-a837-8aa6fe502668}
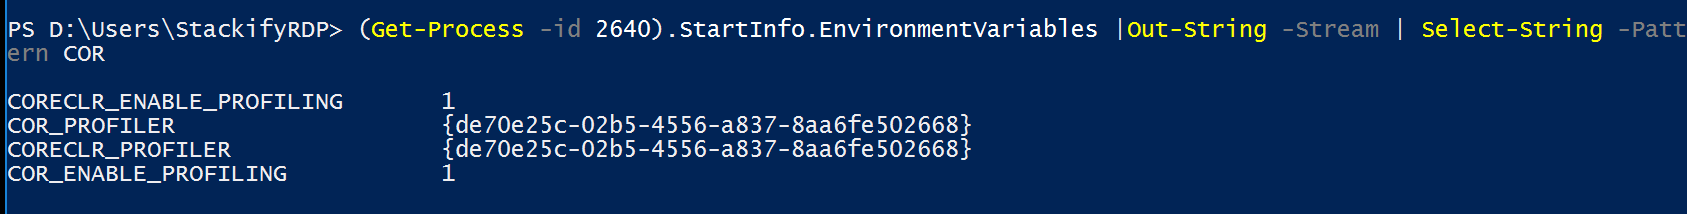
The easiest way to verify if these environment variables are configured is with a simple PowerShell command. Identify the process ID of your application and then run the following command:
(Get-Process -id 2640).StartInfo.EnvironmentVariables | Out-String -Stream | Select-String -Pattern COR
This will output the list of environment variables. You can then ensure the "COR" environment variables are properly set.
If the environment variables are missing, the .NET profiler will never work. You may need to restart your application. Verify that you enabled APM during installation and enable it if needed via the Retrace UI.
How to Troubleshoot the .NET Profiler Loading
When the environment variables are configured properly, .NET automatically writes to Windows Event Viewer a message that states if the profiler attached or not. This applies for Retrace and Prefix both.
Profiler was loaded
When the profiler is working successfully, you will see items that say something like the following under the source of ".NET Runtime".
.NET Runtime version 4.0.30319.0 - The profiler was loaded successfully. Profiler CLSID: '{de70e25c-02b5-4556-a837-8aa6fe502668}'. Process ID (decimal): 2640. Message ID: [0x2507].
Verify that the CLSID is de70e25c-02b5-4556-a837-8aa6fe502668 which is the ID for Stackify's .NET profiler. If a different CLSID shows up, you have a conflicting profiler installed on your server. See the list below of other common class IDs to help identify the conflicting application. This is usually another APM or profiling tool.
Profiler requested not to load
You will also see many messages that says the profiler was not attached. This is normal as the profiler by design does not try to profile every .NET process on your server.
.NET Runtime version 4.0.30319.0 - The profiler has requested that the CLR instance not load the profiler into this process. Profiler CLSID: '{de70e25c-02b5-4556-a837-8aa6fe502668}'. Process ID (decimal): 3884. Message ID: [0x2516].
If it is not being loaded for your process ID and it should be, you may need to configure Retrace to profile that process. This is required for Windows Services and similar background services.
Profiler errors
If you did not get a message saying the profiler loaded or did not load with the proper CLSID, you may have some other errors. Including a CoCreate error or perhaps even crashing by w3wp.exe or your application.
- CoCreate - Another CLR profiler is competing with the Retrace profiler. Uninstall or disable any other profiler.
- w3wp.exe - If the active profiler causes problems with the w3wp service, it can cause crashes among other apps too. See a great blog post about w3wp here: 'What is w3wp.exe? Learn the Basics about IIS Worker Processes'
List of Common CLR Profiler Conflicts
The .NET profiler registers itself with a unique name/guid and only one profiler can be used at a time per server.
| Profiler Name | Profiler Identifier |
|---|---|
| App Dynamics | AppDynamics.AgentProfiler |
| AppInsights | 324F817A-7420-4E6D-B3C1-143FBED6D855 |
| Dynatrace | DA7CFC47-3E35-4c-4e-B495-534F93B28683 |
| Diagnostic Policy Service | 555908d1-a6d7-4695-8e1e-26931d2012f4 |
| IntelliTrace | 2AA1AA98-2CAA-4FCF-86CE-EFA007737E83 |
| New Relic | FF68FEB9-E58A-4B75-A2B8-90CE7D915A26 or 71DA0A04-7777-4EC6-9643-7D28B46A8A41 |
| Ruxit | B7038F67-52FC-4DA2-AB02-969B3C1EDA03 |
| SCOM APM | AD5651A8-B5C8-46ca-A11B-E82AEC2B8E78 |
Other Common Issues
- Classic application pool mode - If you are running your app pool in Classic mode, there are additional steps. Please read the following document: .NET Agent Installation: Enable Classic IIS App Pools.
- .NET Runtime version - Retrace supports both .NET 2.0 and .NET 4.0 runtime versions, but if you're using .NET 2.0, some minor configuration changes are required. Please read the following: .NET Agent Installation: Advanced Topics.