Once the first version of your application goes live that’s when the need to operate it begins. Service management is an entirely different area in the software development lifecycle. It requires different sets of processes, tools and different sets of skills. In this post we’re going to discuss the processes under service operations of ITIL v4 Service Management and explain how tools like Retrace can help your operation support be more efficient.
Service operation is one of the stages of ITIL v4 service lifecycle and it is primarily focused on keeping delivery of services efficient and effective.
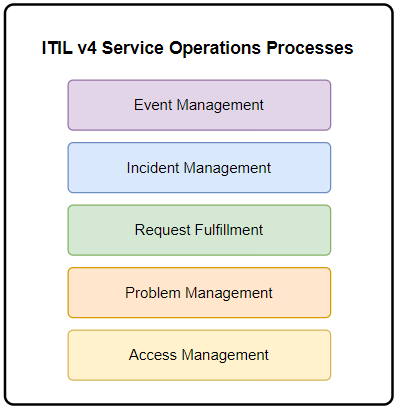
Request Fulfillment
Request fulfillment is the process of managing requests from users. Usually, these requests are ad hoc and can’t be performed with the normal use of the application. Examples are ad hoc data extraction or report generation and backend update. Ideally, these requests are communicated to the support team using a ticketing tool that supports inputting of request details, sending of notifications, categorization. prioritization and updating of status. For high service maturity teams, these requests are periodically analyzed to look for potential new features in the application. If a request becomes too often, a new feature can be developed to automate the fulfillment of the request. Thus, freeing up valuable time of the support team to do more value adding tasks such as enhancements, fixes and new features. For example, if a specific report is frequently requested the report can be added as a feature of the application.
Access Management
Access Management is the process of granting access, removing access and setting access level per user. In some applications this process is manual but, in some applications, this is already automated. This process must be aligned to defined security policies in the organization.
Event Management
Event management is the process of handling events that impact the operation of the application throughout its lifecycle. It covers monitoring, detection and analysis of trends with the intent of coming up with action items to ensure that the event doesn’t negatively impact the operation of the application or at least minimize the impact if it’s totally unavoidable. Whenever an event is detected or an event notification is received, it must be logged somewhere for tracking purposes.
This is one process where performance monitoring and error and log management tools like Retrace become very important because they can automate detection of application events.
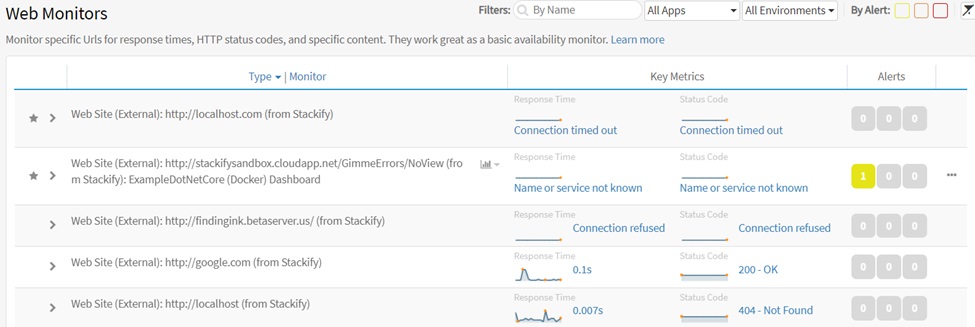
Web site monitoring feature of Retrace can be used as an event monitoring tool. It can trigger alerts and send notifications whenever a page being monitored becomes inaccessible.
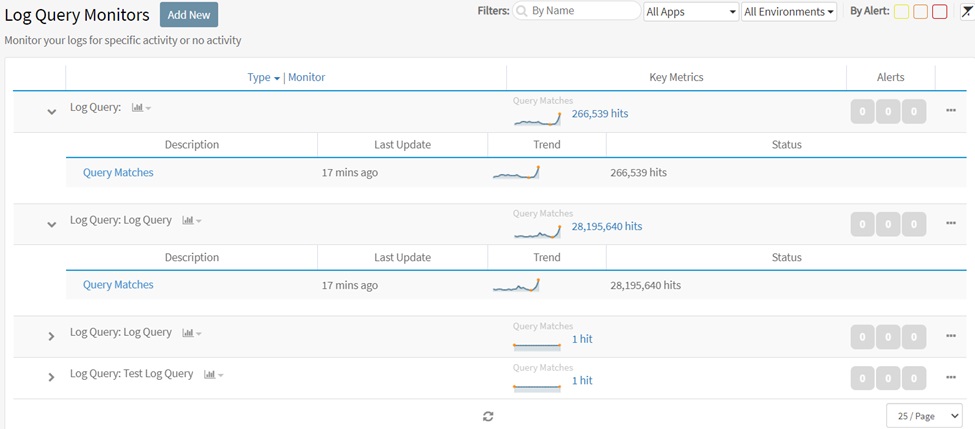
Log query monitoring feature of Retrace can also be used as an event monitoring tool. It can be used to monitor logs, trigger alerts and send notifications. One example implementation is when you try to connect to a database, it fails and the app attempts to reconnect three times. Each time you get a connection failure, you can write a log of the connection failure. With the built-in retries, the connection may eventually succeed but the failure can be interpreted as a warning and can be investigated further. Log queue monitor can be used to detect these intermittent failures. It can generate alerts and can also send notifications. You can also set a threshold in the number of occurrences for a specific period, e.g., if it fails 3x in one day you can trigger an alert to be generated.
Other event monitoring features of Retrace:
• Performance monitors
• Error alerts
• IIS App Pool monitor
• IIS Site monitor
• Key Transactions monitor
• Server – Disk monitor
• Server – OS monitor
• Server – CPU monitor
• Server – Memory monitor
• Server – Stackify Agent Health monitor
• Network Interface monitor
• File monitor
• Custom metrics (e.g. Windows Performance Counters, JMX MBeans, StatsD, etc.)
• Error rate monitor
• Queue monitor (Azure Queues and RabbitMQ Queues)
Aside from infrastructure, environment and application events, there are also other variables that an operation support team must keep track of like configuration items or CI. CI includes all application components, framework and operating systems upgrades and patches. Normally, all these dependencies are monitored regularly by the operations support team and upgrades and patches are managed accordingly. Managed means the upgrade/patch is known ahead, impact assessed, scheduled, tested and adopted.
Incident Management
Incident management is the process of handling and resolving issues detected internally or reported by users. An incident may be as serious as breakage of a feature, degradation in performance or as simple as verbiage or other low impact issues. When an incident is reported, it’s important to verify the incident, assess its impact and determine its priority. Monitoring tools such as Retrace can be used in incident verification and troubleshooting. Depending on the nature of the incident, dashboards and graphs are good starting point when verifying and troubleshooting an incident. For example, if the incident reported is the user is unable to open a report in the application, the support resource can perform the following tips to troubleshoot the problem:
Troubleshooting tips:
-
Take a look at the application dashboard and look for anything unusual in the different metrics displayed. This is where it becomes important for a support resource to be familiar with the day-to-day trend of the metrics in the dashboard and the profile of graphs. If there are metrics unique to the application, it also helps if custom metrics are created in the Dashboard page because it helps a lot in monitoring and troubleshooting activities.
-
Take a look at the Alerts to see if there’s anything new generated within the time frame of the incident. There may be times when alerts are not generated by default especially if the incident is triggered by an application specific logic. It would help a lot if the support team pre-configures generation of alerts using the different monitors of Retrace.
-
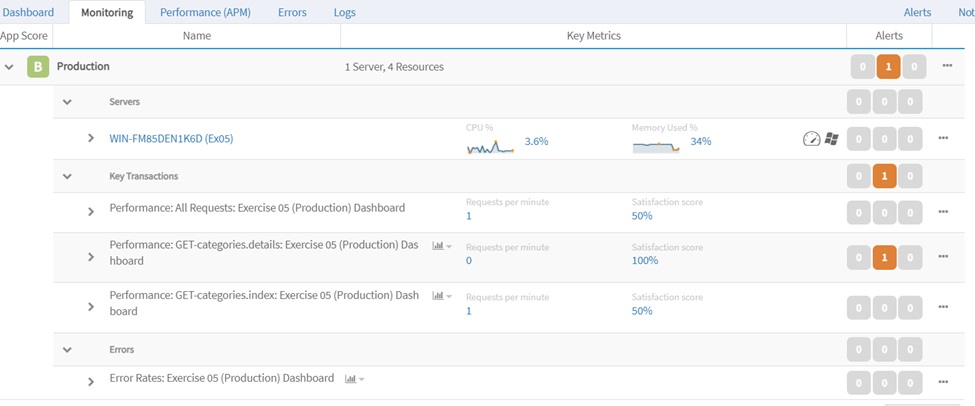
To rule out the possibility that it’s an environment issue, the support resource can access the [Monitoring] tab to check the server status. The tab also shows the status of Key Transactions monitored and a list of Errors.
-
Once the support resource has an idea of the requests affected by the incident reported, the support resource can use the [Performance (APM)] tab to trace the request and look for anything abnormal in the flow of execution or look for failures. If the incident is related to performance degradation, the Performance graph is a good starting point for the investigation. The execution time per request/method can also be used to determine long running requests/methods. The ability to trace the source code for me is the most important feature of any APM tool because it technically gives the support resource or the developer, the ability to perform debugging in the production environment.
-
[Errors] tab and [Logs] tab are good features which can be used to check for error messages and logs that were generated within the time frame of the incident occurrence.
Problem Management
Problem management deals with identifying and resolving for good recurring incidents in the application. Support teams with high service maturity are able to analyze incident trends and identify inherent problems and gaps in the current implementation and look for ways to resolve them for good. The goal is to be able to achieve a certain level of stability of the application which results to higher user satisfaction and lower cost as far as operating the application is concerned. Some support teams set annual targets on the reduction of man-hours required to do recurring tasks and a good problem management is the key to achieve this goal.
Takeaway
Some service operation processes are quite complex and requires periodic performance assessment to be able to achieve the goals of the business. That’s why it’s important to identify support key performance indicators (KPIs) to be able to determine if the operation is improving, performing well or not. Operation support in itself though important is not directly value adding. Hence, it’s important to ensure that it’s being done in an efficient and effective manner.