Stackify strives to improve how developers monitor and troubleshoot application problems. Our solution was built having in mind the numerous application performance monitoring tools that exist in the market yet failed to cater to every developer’s needs. Most applications require multiple isolated tools and were designed for huge IT operations. There is no Application Performance Monitoring (APM) solutions that solely cater to the developer's perspective. Retrace changes the paradigm by combining exactly the needs of the developers - what they needed to see and how they wanted to see it.
We call it Retrace because of its ability to help you retrace what your code is doing and to quickly find bugs and performance problems.
Retrace is an easy-to-use SaaS application monitoring solution that combines several key products:
- APM - code level application performance visibility
- Transaction tracing - code level traces of what your code is doing
- Metrics - server, application, and custom metrics monitoring
- Logs - aggregation, searching, and management
- Errors - aggregation, reporting & alerting
- Alerts - robust monitoring and alert capabilities
Retrace collects a huge amount of data about your application’s health and performance. The combination of all of this data in one place plus an easy-to-use user interface for developers make Retrace distinctive from any other APM solution you have ever used. It does not matter if it is your first day on the job or you've been supporting the same app for years, with Retrace you can see everything you need to without any guesswork.
Below is a screenshot of Retrace where you can see how easy it is to access monitoring metrics, performance reporting, errors, and logging for a single application. You can also see a detailed chart that clearly shows that external Web service calls account for most of the response time being taken.
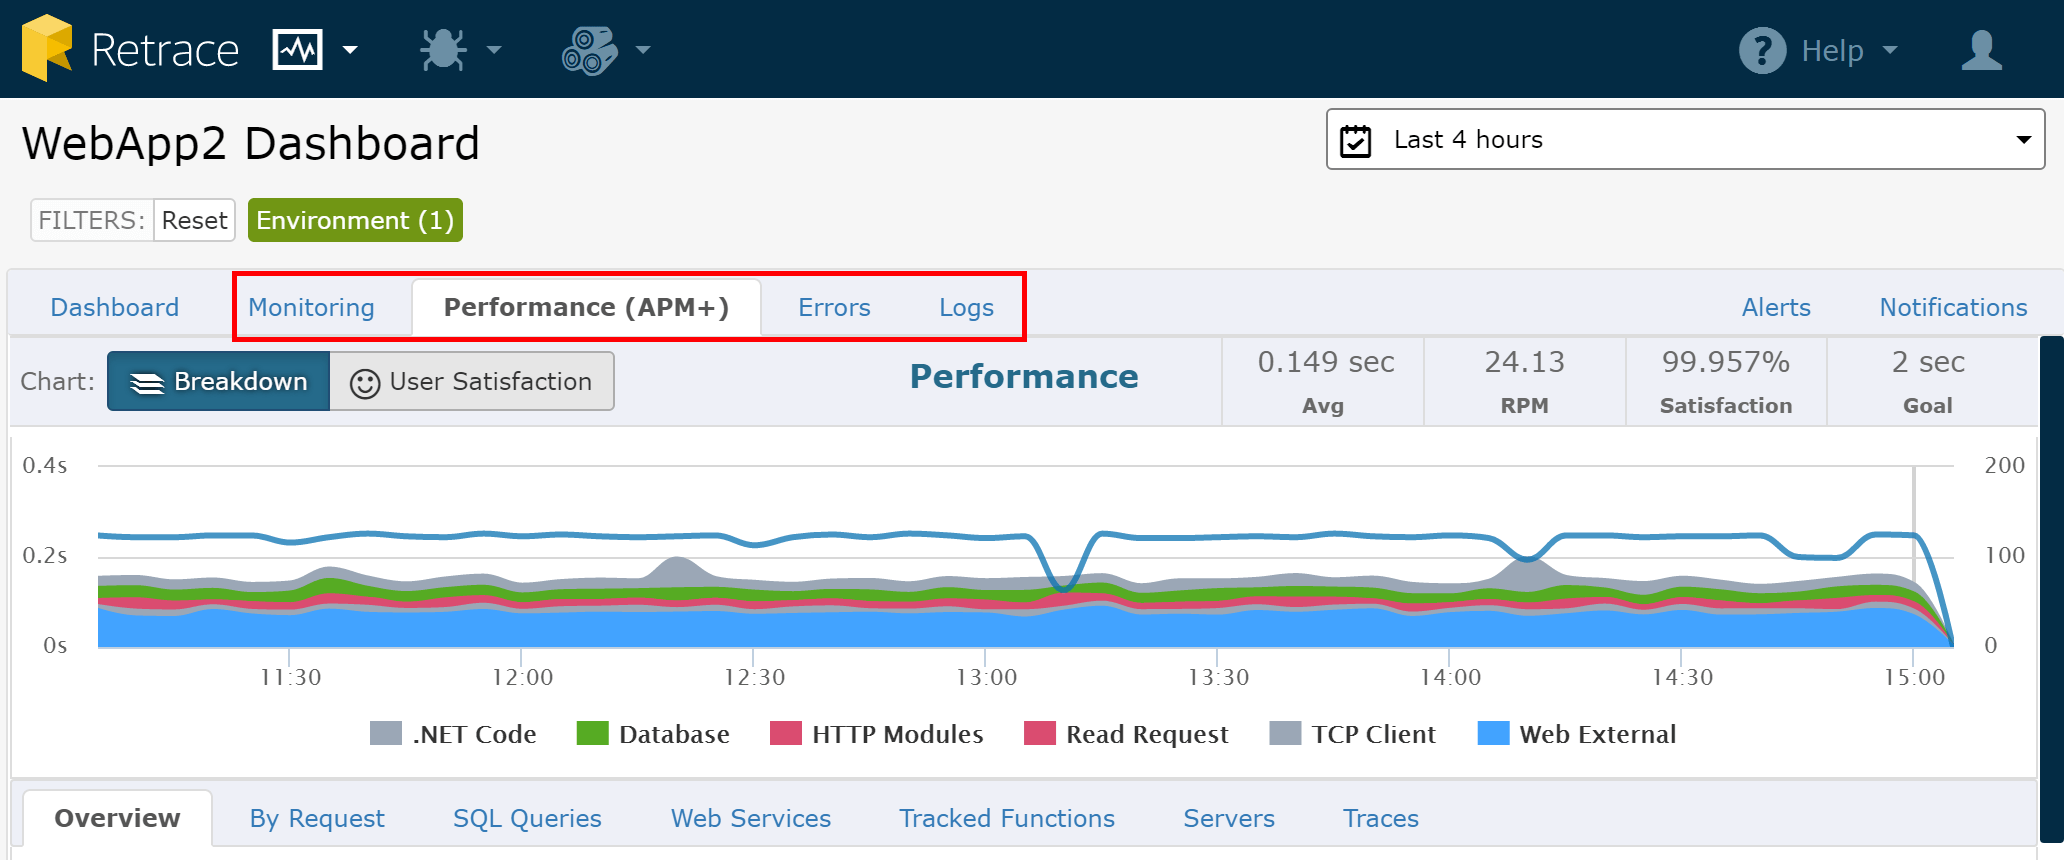
Retrace Application Monitoring Consists of Six Integrated Modules
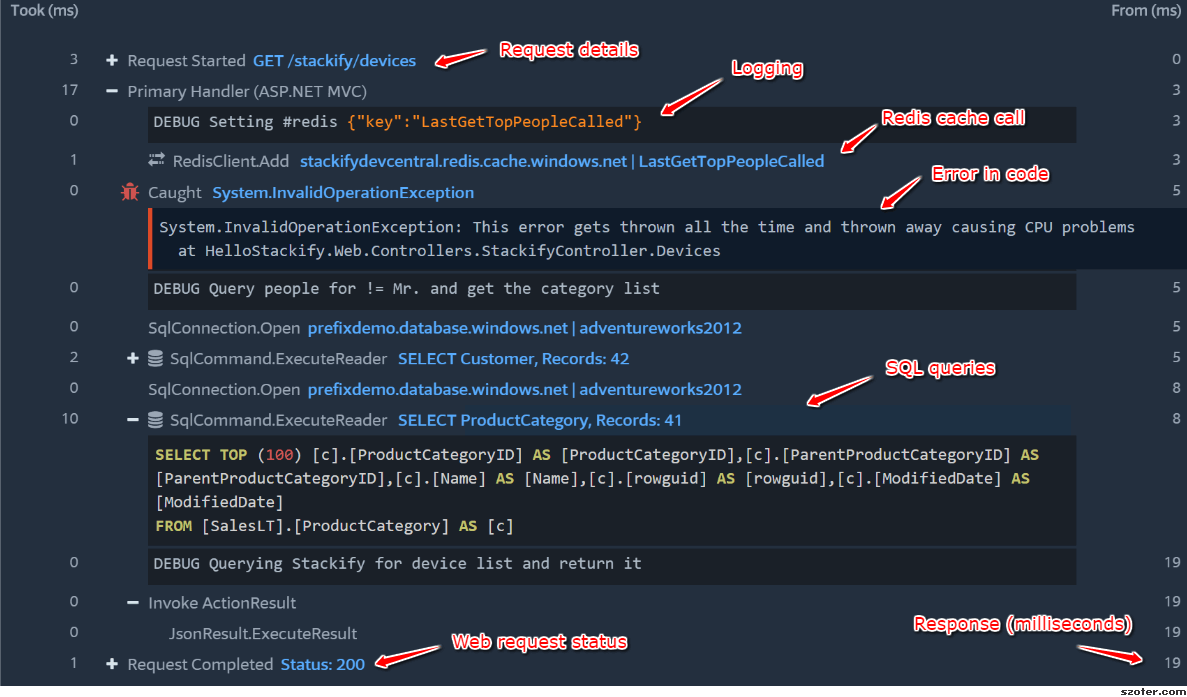
1. Transaction Tracing
At the heart of Retrace is its ability to collect detailed performance data and transaction traces for your applications. We call it Retrace because of its ability to help you re-trace what your code is doing to quickly find bugs and performance problems. Traces contain these types of data:
- Web request info like URL, resources, etc.
- Key methods in your code
- What dependencies did your code call (SQL, caching, HTTP calls, etc.)
- Application errors
- Logging statements
Retrace provides the most detailed traces you will find in any application performance monitoring software or APM solution. Try our free tool, Prefix, on your dev box to get the same powerful tracing ability.
2. APM - Code Level Application Performance Monitoring
Retrace collects detailed data via its code profiling and transaction tracing capabilities. All of the data is aggregated and crunched to provide powerful reporting and alerting capabilities. With Retrace, you can quickly identify why your application is slow or why it is not working properly. Key APM features include:
- Monitor app performance by response times, user satisfaction, etc.
- Understand performance based on application dependencies
- Identify slowest and most used Web requests
- Monitor key Web requests or transactions
- Identify slowest and most used SQL queries
- Monitor the performance of specific SQL queries

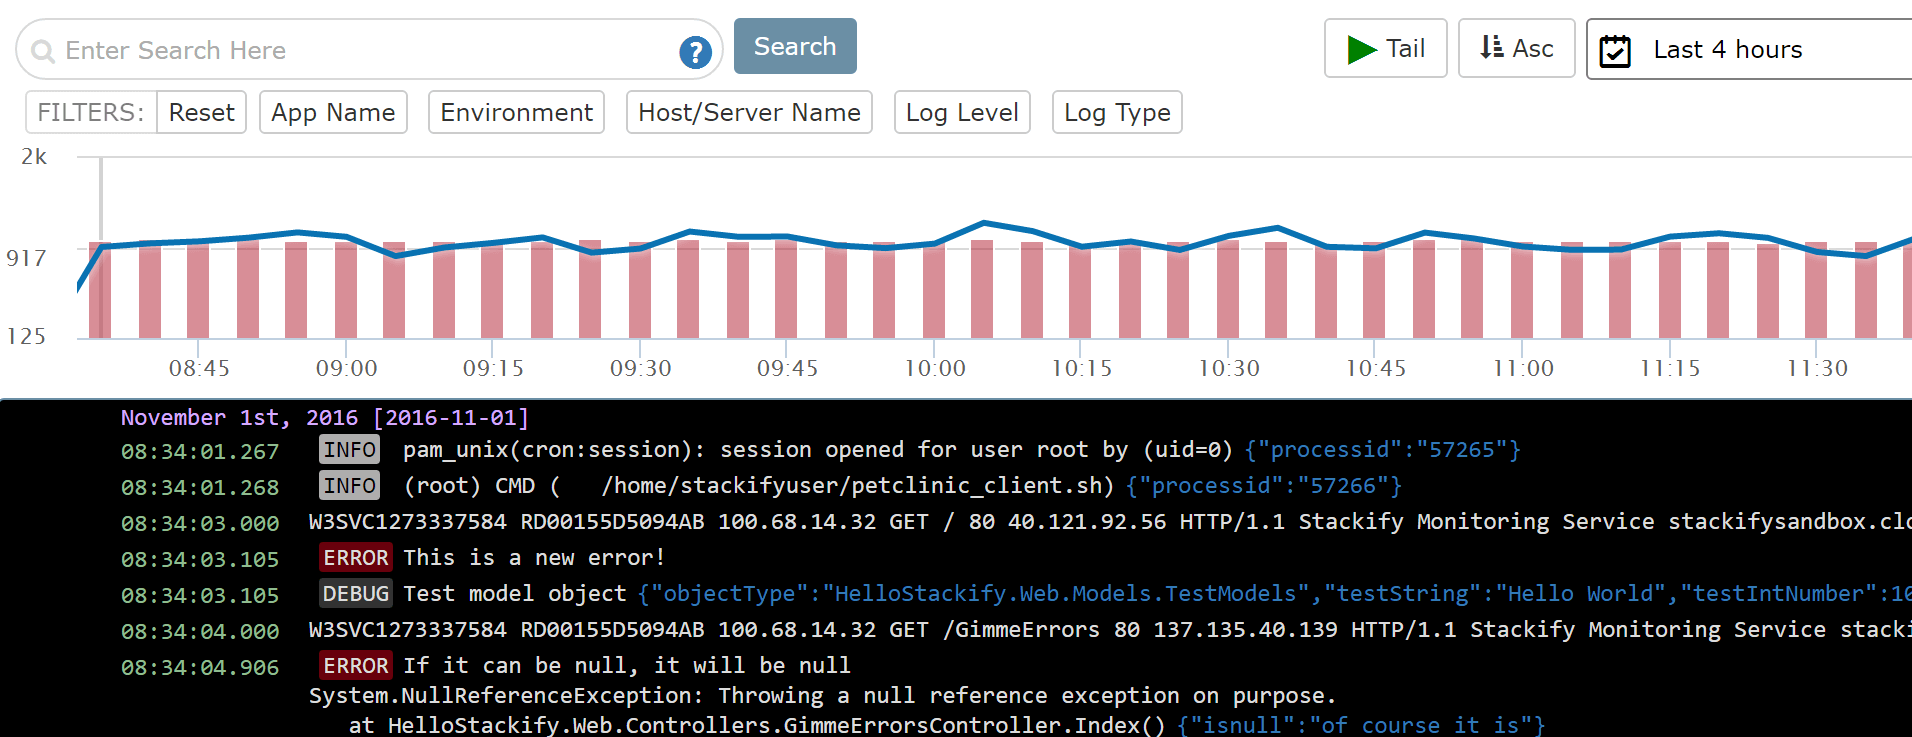
3. Log Aggregation, Searching, and Monitoring
Retrace enables you to centralize all of your application and server logs in one place. Full-text searching and support for structured logging makes it easy to find anything you want to see in your logs. You can even set up log searches to run every few minutes and alert your team if anything is found.
Application logs are supported by common logging frameworks like log4net, NLog, log4j, logback and more. Server logs from syslog, Windows Events, and Web server access logs are also supported.
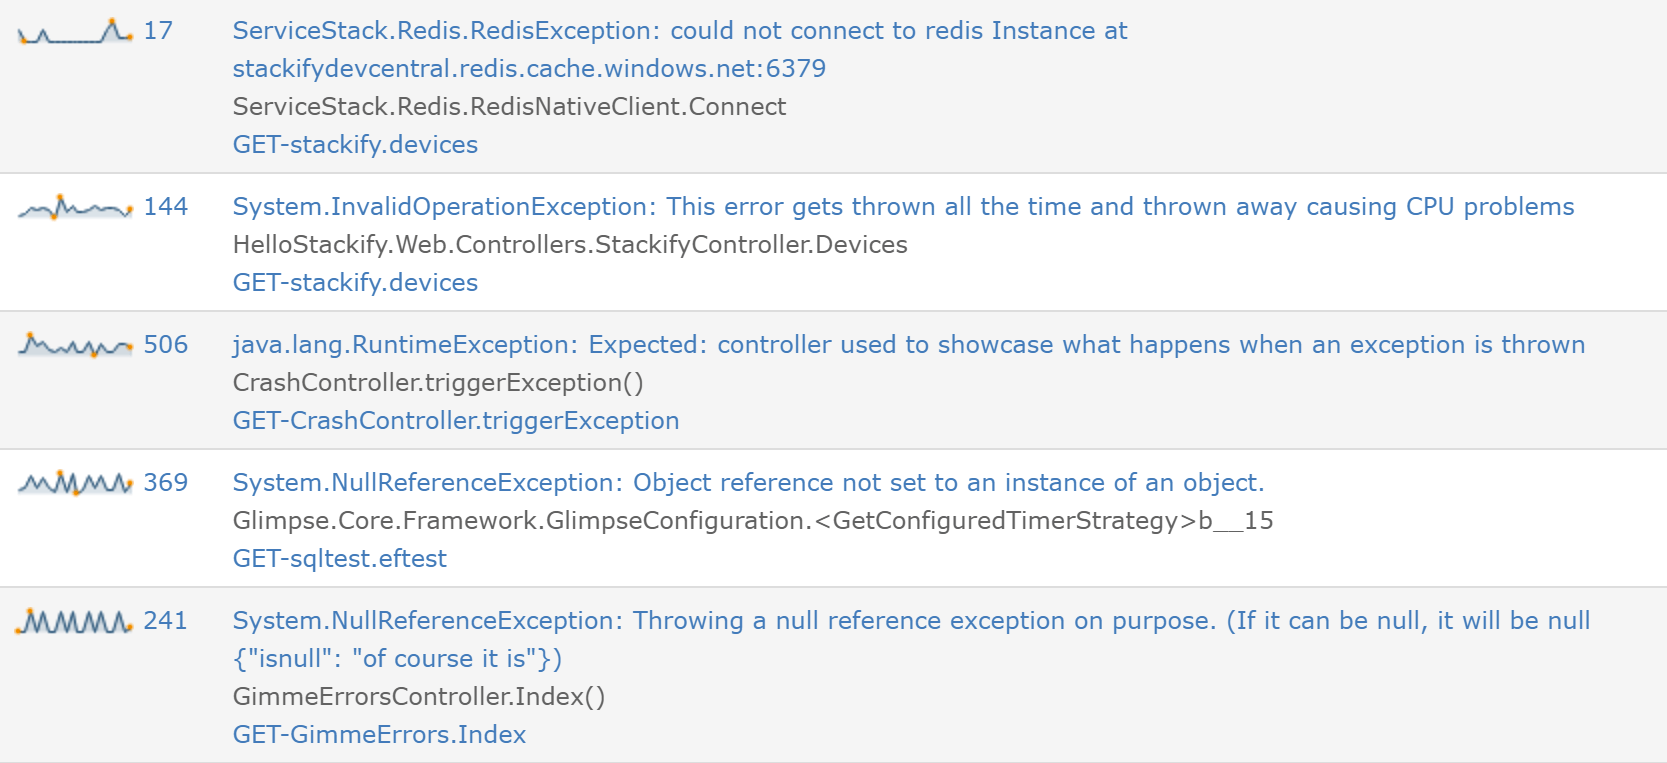
4. Application Errors Tracking, Reporting and Alerting
Stop logging your errors to log files that you will not even bother looking at. Let Retrace collect all of your exceptions and send you an e-mail when new errors are found. Exceptions are uniquely identified and alerts can be set up based on error rates per application. With Retrace, you can see all the logging statements that occurred in the same Web request and potentially see the complete transaction trace that was recorded. The ability to transition from finding an error to fully understand what was going on is quite fulfilling.
Monitor unique application errors
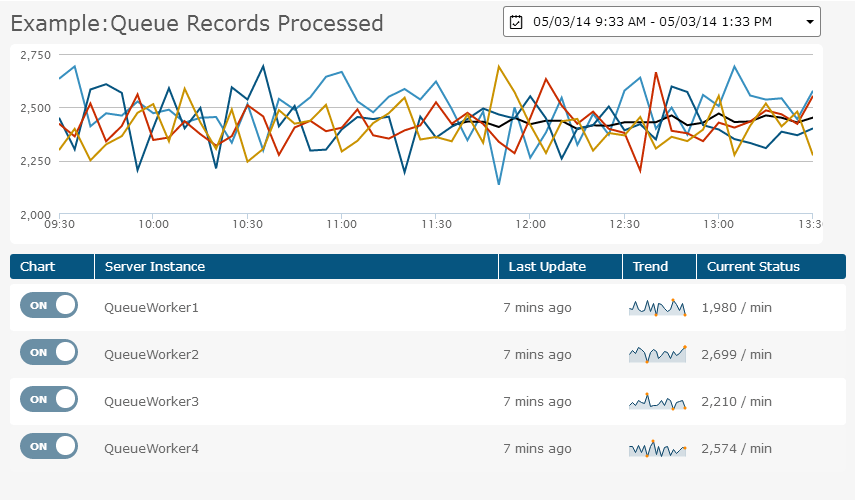
5. Server, Application, and Custom Metrics
It is important to monitor basic server metrics like CPU, memory, network, and disk performance. Developers can also monitor their applications and track processes like garbage collection, request queuing, transaction volumes, page load times, and many more.
Here are some of the types of application metrics that you can monitor:
- Windows Performance Counters
- JMX mBeans
- Custom application metrics
- Error rates
- Custom metrics via Retrace API
Powerful charting and dashboards make it easy to analyze and provides a trend for your monitoring metrics.
- Built-in dashboards
- Interactive charting
- Easily compare metrics across multiple servers
- See trends at a glance with sparklines
6. Fully Integrated Alerts
Retrace can monitor the different parameters about your applications and send you alerts when something is not working properly. Alerts are grouped by application to show all open alerts for the application in one view instead of a flurry of e-mails. Retrace provides a wide array of performance monitoring capabilities.
- E-mail, SMS & Slack notifications
- Escalate alerts if not resolved or if severity worsens
- Configure notifications differently by app and server