Using Environments you can create application specific monitors that only apply to the chosen app within the selected environment. Follow the instructions below to configure app monitors.
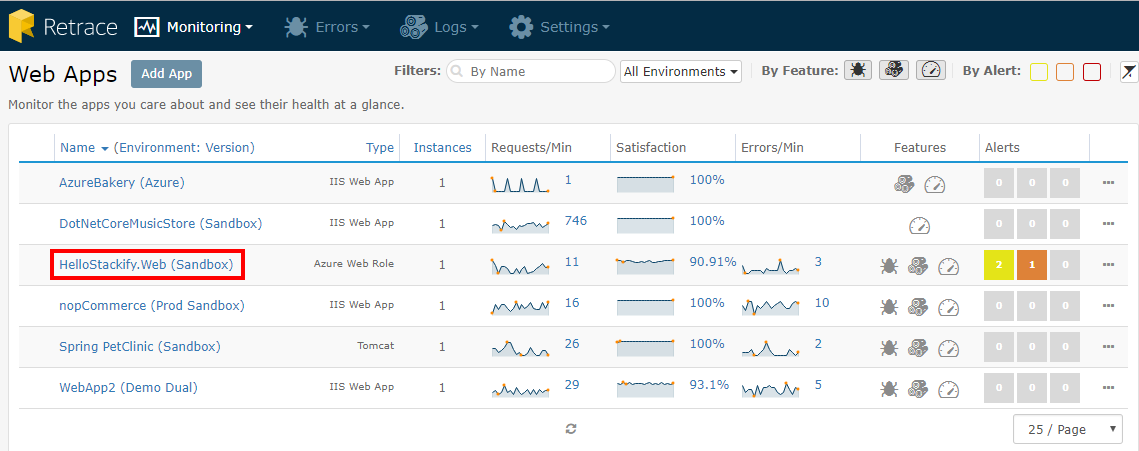
- Go to Monitoring > Web Apps and select an Application of your choice
-
- Once in side the App Dashboard go to > Monitoring. Here you can configure monitors for the application. In order to change the filter to all apps of the same name click Environment

- By default the application is filtered by a single environment, however, if you have multiple instances of the same app that are assigned different environment names you can see those environments here.

- Click Configure to start editing monitors for your App.

- Here depending on how you have set your filter (see step 2. b.) you can choose which environment you wish to create monitors for. It's common to only have one option.
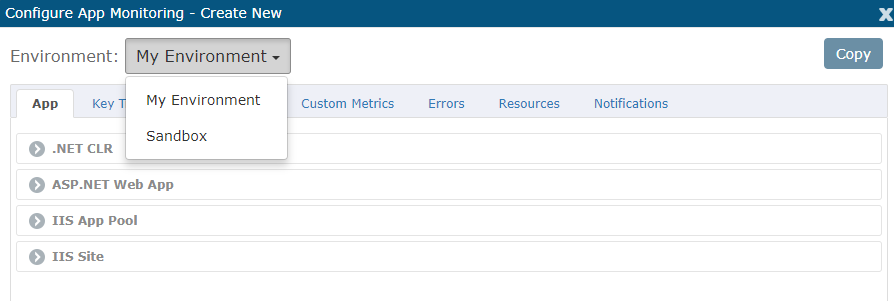
App Monitors
When configuring App monitors, you will have the option of establishing the thresholds and waiting period before a Warning, Critical, or Outage Alert occurs. To see how this is controlled, you can find more information in Configuring Your First Monitors. For each group, you are able to set the Frequency with which the checks are made for all monitors within the group.
In each monitor category, the applicable monitor types are available from the drop down list at the right.
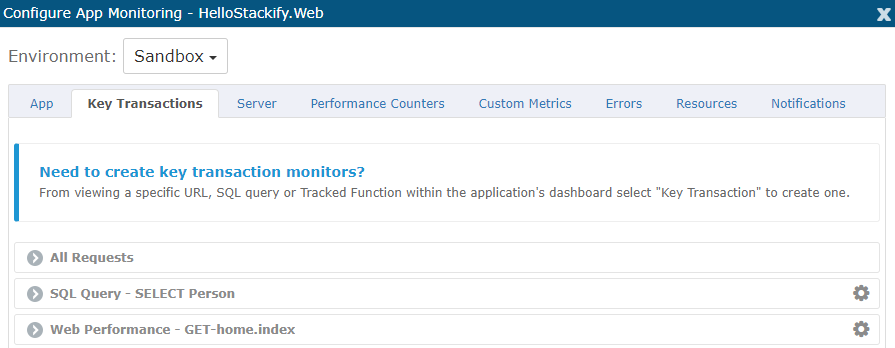
Key Transactions
For the Key Transaction Tab you can add monitors for specific SQL queries or Web Requests for your app's performance. These additional queries and web requests are discovered by the Retrace Agent in APM. To add your own take a look at Creating a Key Transaction in Monitors: Key Transactions.
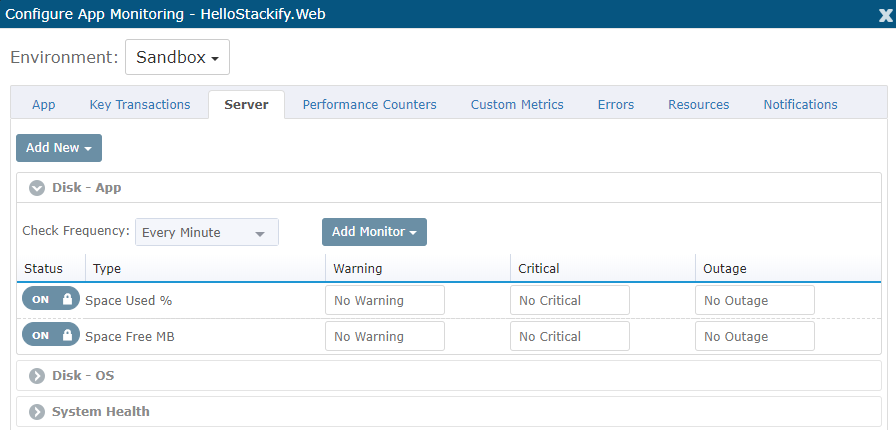
Server Monitors
Much like App monitors, the Server monitors will monitor system-related health across all servers running this application in the chosen Environment. By setting up Server monitors at the App level, any server outages will automatically propagate out to their impacted applications as well. This also ensures that any new servers running the application in this environment will fall under this application monitoring configuration.
Performance Counters (Windows)
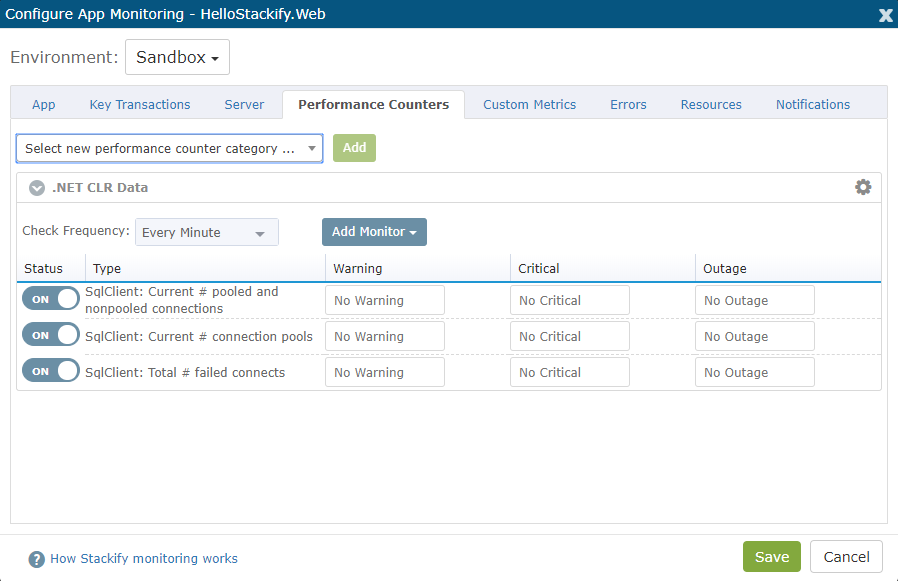
As the App and Server configurations also utilize Performance Counters under the covers, it's generally a good idea to start your search for monitors under the appropriate category under one of those tabs first, and then resort to Performance Counters tab last.
MBeans Monitors (JMX)
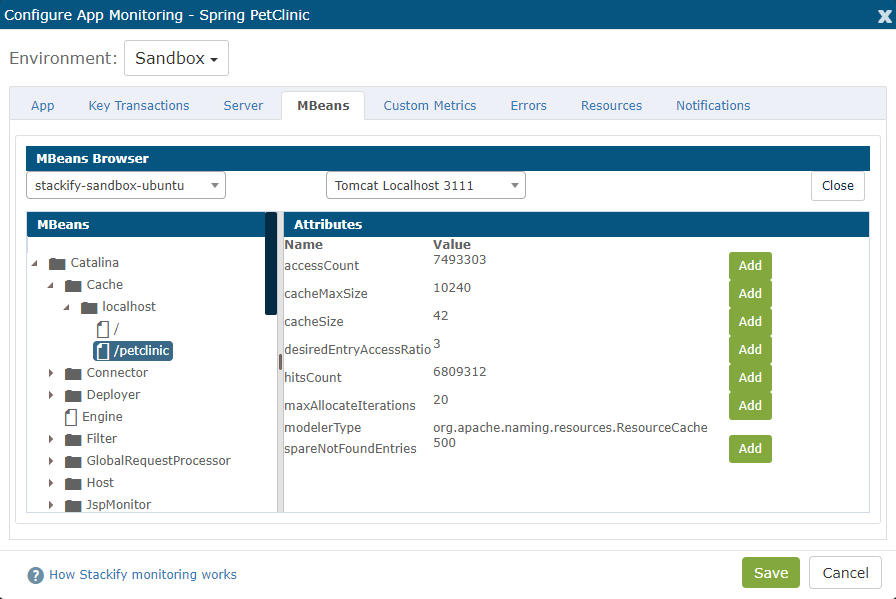
Once you have a working JMX connection for your Java App running , you will be able to add MBean monitors to your App Dashboard. To configure MBeans, you will need to browse through the different MBeans to find the ones you want to add. Once added, they will be reflected below, where you can set the Alert thresholds. (Not available for IIS).
Custom Metrics
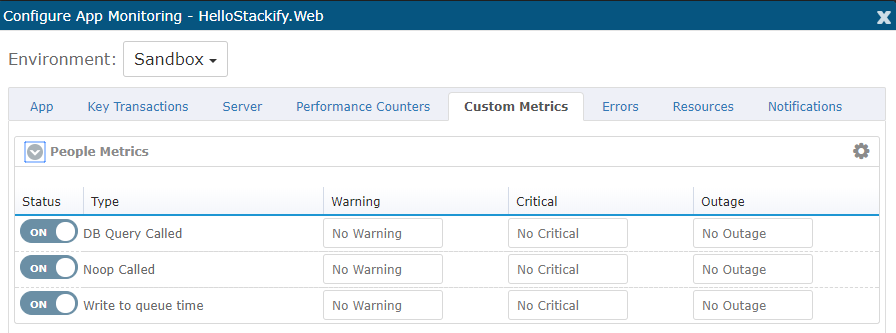
By using the Stackify Custom Metrics API, you can add your custom metrics to the App Dashboard. Once Retrace begins receiving your custom metrics, each metric can be configured to alert and notify when thresholds are exceeded. If you discontinue using a custom metric, you can also remove old metrics from the dashboard here. To learn more about Custom Metrics take a look at our Custom Metrics: Overview.
Error Rate Monitors
There are two error count monitors that can tell you how many errors you've reported in a given time - either # of errors in the past minute, or # of errors in the last 60 minutes. These error count monitors can tell you when you've had a spike in active errors, regardless of what kind of error it might be.

Resource Monitors
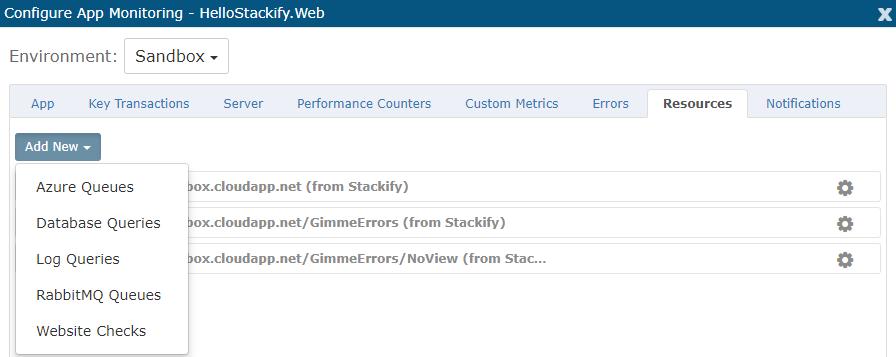
A Resource in Retrace is external to the App. Resources are what help the App complete tasks, convey external measurable indications of App health, and are what the App is dependent on for proper function.
Here you can configure monitors on:
Notification Settings
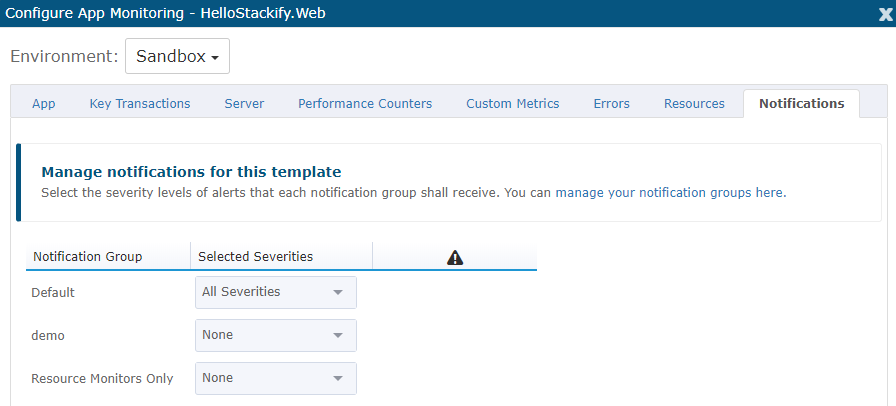
Your Notification Group will specify who receives emails and SMS messages when a Monitor goes into Alert state. You can set multiple recipients of these Notifications in any of the severity levels, and all will apply to this App in this Environment for all Alerts.
Save and Copy App Monitors
Once you have configured and saved your App monitors for the selected environment, all of these App monitors will propagate out to all applications running within the selected Environment, including for new servers that are later added to the environment and detected to be running the application.
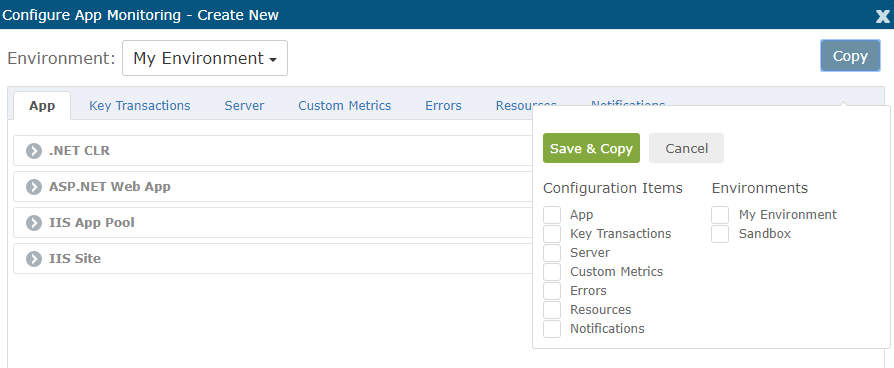
However, if you want to copy certain configurations items and apply them to other environments, you can do this by checking the checkboxes as seen above. The Copy and Save feature will be available in the Configure App Monitor window for your Apps that belong to more than one environment.