This article is intended to give you an in depth look at all the features of the Log Dashboard. If you have not already downloaded and added a Stackify Log appender or the Stackify API to your app, see the article on Errors and Logs Overview.
Logs Dashboard
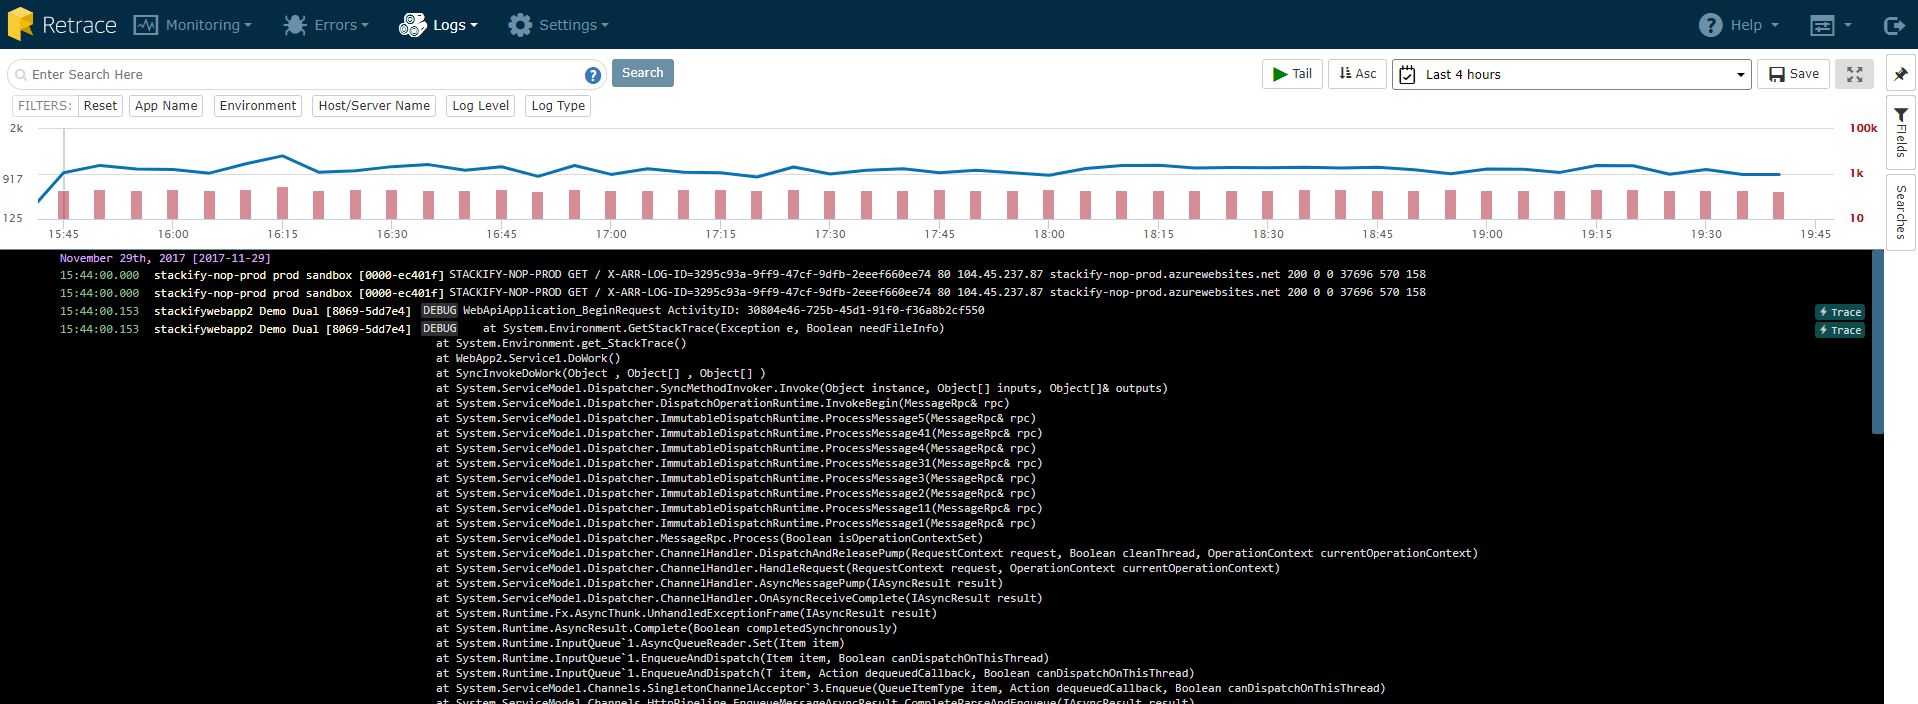
After installing the logging appender, you will be able to configure your App to integrate logging data into the Log Dashboard. This data will help you find contextual insights about your apps that can assist you in solving any error you might face. View all logging messages in an inline view across all apps, on all servers, and in all environments. Along with this comes the ability to tail log files in real time and search through all the logs of a given app.

In-Line Log Messages
Depending on how you configure your logging levels for the logging appender, you will be able to see different logging statements in-line with your errors. This dashboard will give you valuable information leading up to an error so you can better troubleshoot why an error occurred.
Get a Closer Look at Your Logs
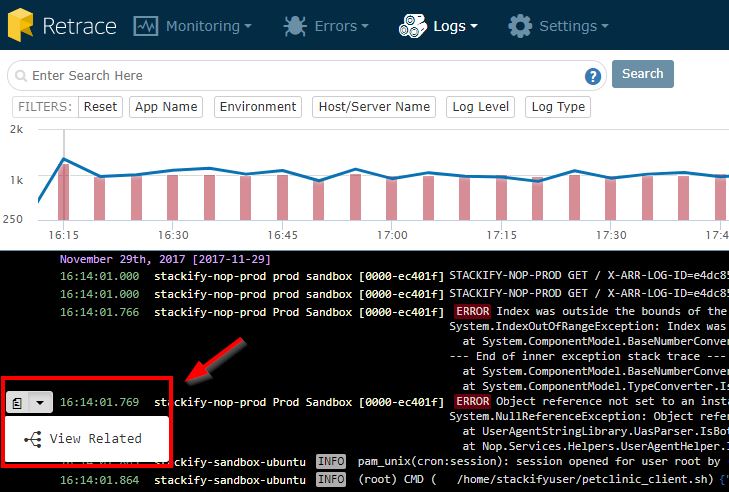
If you hover over a log entry, you will see a document icon on the far left. Click the caret next to the document icon to see the 'View Related' option. By selecting this icon, you will be able to see every log message at a closer glance surrounding the line you selected. You can view more log messages in-depth in either direction.

View Error Details
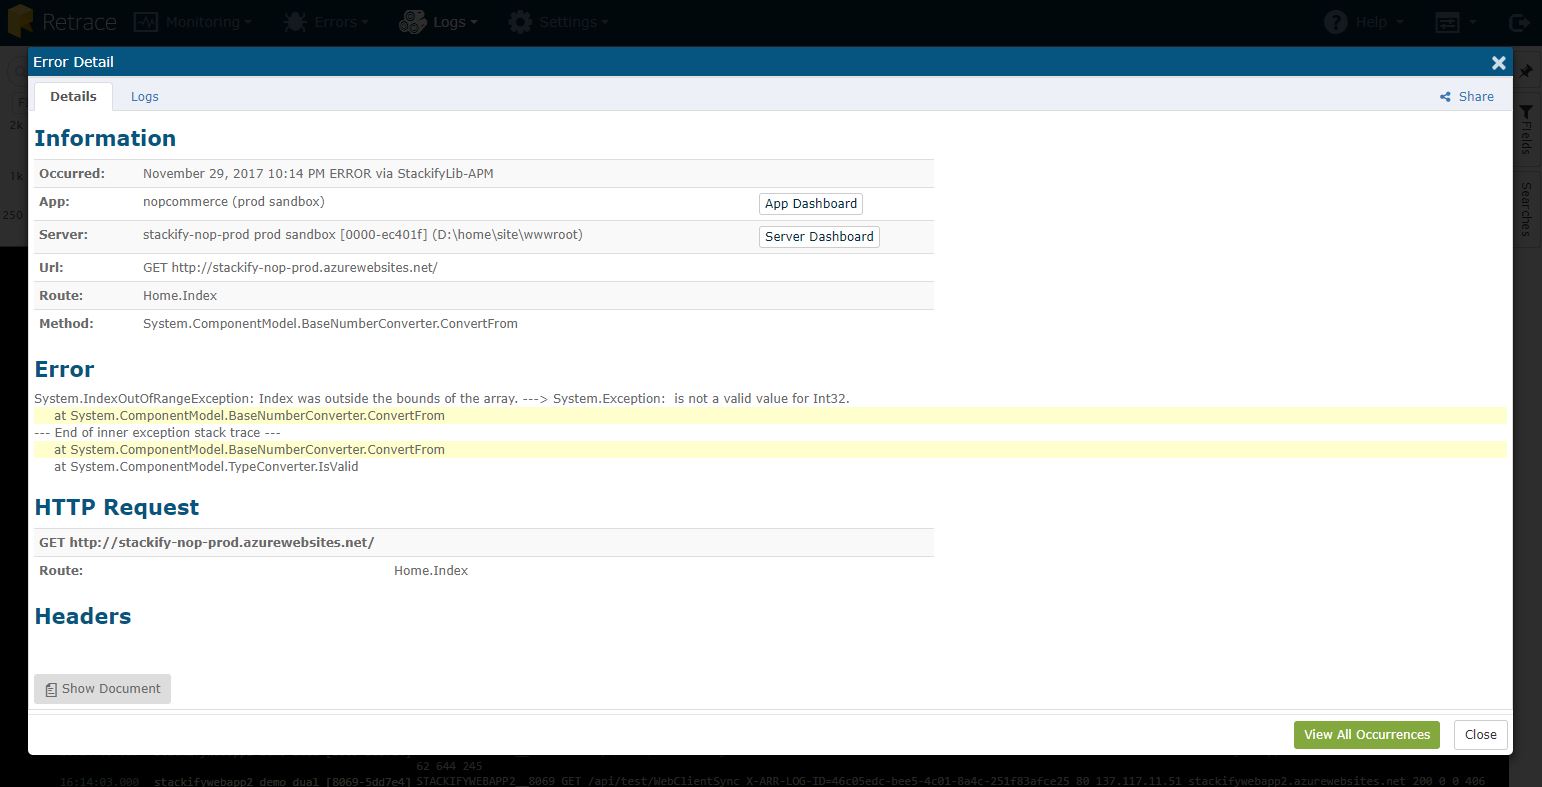
To get more information on an error you see in the Log Dashboard, click the icon to the right of the error. ![]()
This will give you additional data specific to that error. You can find more information on this data in the Error Details article. You also have the option to view the logs around the Error. Just click on the 'Logs' tab inside the 'Error Detail'.

View Documents
For any given log message, you can select the View Document icon to the far right of the log message. This will give you additional information about your logs in-line with the rest of your log statements.
Real Time Tailing
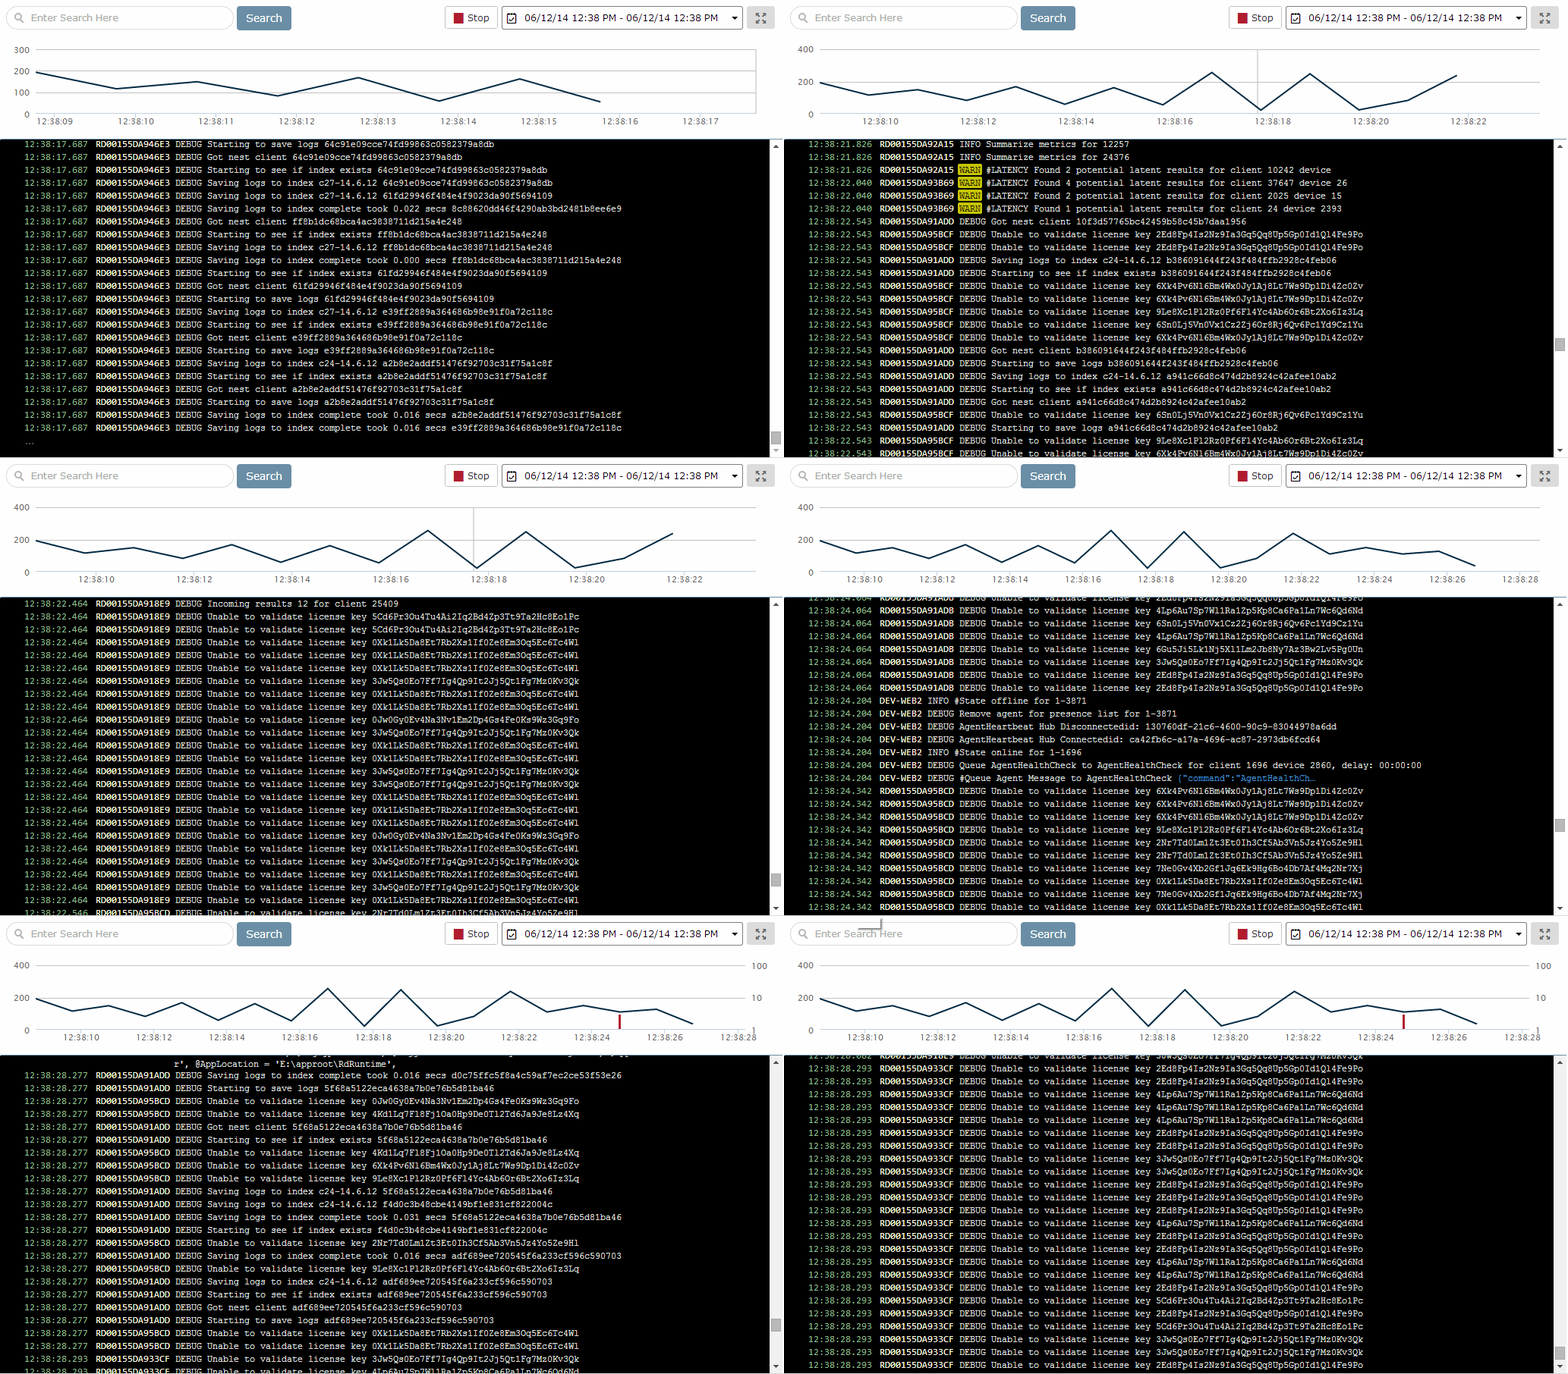
With tailing, you can view new logging statements as they occur. This allows you to see logging within your applications across multiple servers simultaneously in real time. Just click the 'Tail' button.

Filter, Search, and View Your Logs
Pinpoint your errors by applying filters and fields to weed out unneeded information. You can isolate the logs that you are looking for by specifying the Environment, Server, or Application. You also can search for terms in your Log messages. To see more information on search syntax, view the article on Querying for Logs.
Adding Tags to Your Log Messages
You can "tag" important words or phrases in your log messages using a hashtag(#) symbol as seen above. You will then be able to search by applying filters and fields for these tagged words in the logs and errors dashboards. Below will show you how easy it is to locate a tagged phrase using the dashboard.
First, select the Tag field and apply the filters of each tag you want to display. You will then see each message with that tagged word or phrase.
You can also select a tag label in the log message to see only those tags.

Saved Searches
You can save your searches so you can easily revisit them later.

Log Query Monitors
In addition to saving search terms, you can also set up monitors for saved searches. Set up alerts to be notified whenever a query is matched. To learn more about how this works, visit the Log Queries article.