Retrace's APM is a powerful feature and serves as a core part of our Application Monitoring service. The feature implements byte code inspection of apps, giving you method-level telemetry on code at run time. Use this tool to get instant insight on:
- Start time / end time and HTTP status codes
- HttpHandlers and HttpModules utilized in the IIS pipeline
- Call Stack of key methods / pipeline execution steps, i.e. controller execution, viewing compilation, and viewing rendering
- MS SQL database calls, including the query text
- Web service calls, including the requested URL
- Redis cache calls
- Request Queuing & Blocked - Estimations in delays of processing the request. Queuing being time before the request is started and blocked is time it was delayed after it was started.
Once the Retrace profiler has been configured and enabled, the Retrace agent will be able to facilitate data collection and push that data to your account. To viewRetrace data, go to the Monitoring Tab>Web Apps and open the App Dashboard for an app that has profiling enabled. Once in the App Dashboard, click on the Performance tab.
Using the Performance Tab in the App Dashboard
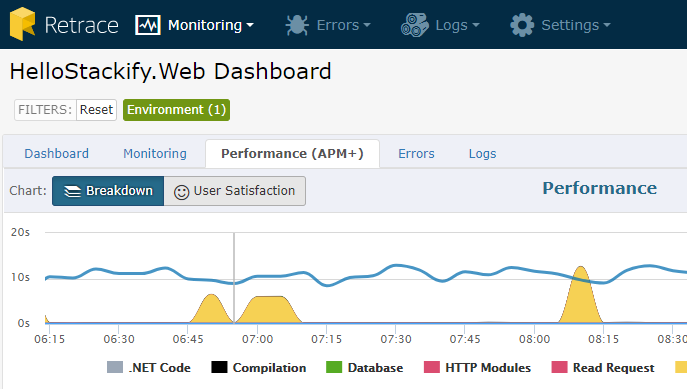
When you click on the performance tab in an application dashboard, you will be able to view a breakdown of your average page load times by components that make up your app. Quickly see if database queries, caching, queuing or other parts of your stack are causing app slowness.
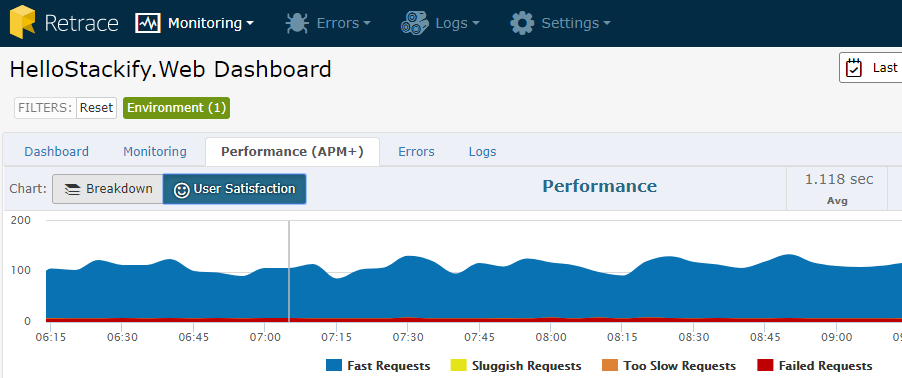
You can also click on "User Satisfaction" to view a chart of Fast, Sluggish, Slow, and Failed requests based on the goal you set for response times.
Overview Tab
The Overview tab will give you a quick look into the top 5 Requested Actions, the top 5 Queries, and the top 5 external web services, all sorted by the percentage of time it accounted for. To the right of each "Top 5" table is a chart to visualize the top web requests, top queries, and top external services.You can also click on any requested action or SQL query link in the tables to see a more detailed performance view for that requested action or query. There are a number of different views you can select to help you investigate app performance issues. These different views include By Request, SQL Queries, Web Services, and Servers.

By Request
The By Request tab shows all captured requests from the application that can be sorted by a variety of fields. Here you can click into each request and see any traces as well as Sat scores around the request.
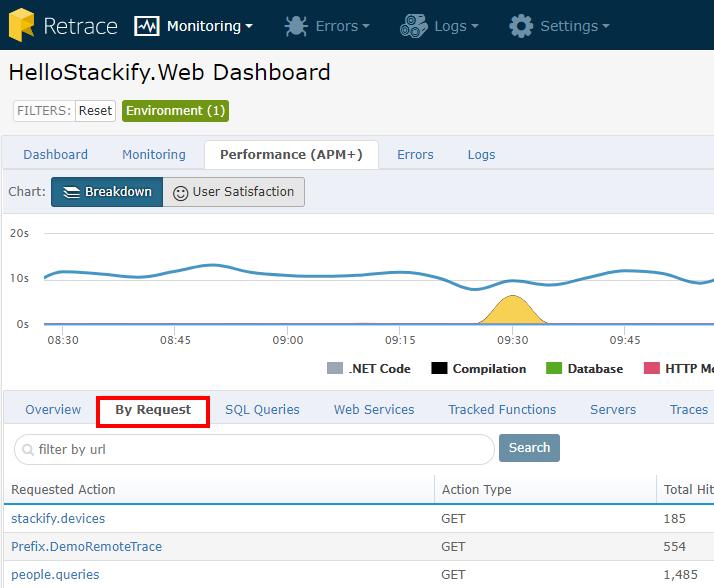
By clicking on the requested actions link listed below the Satisfaction chart, you will be taken to an individual detailed view of a specific request. Here you can see a similar Satisfaction chart that is time specific to the requested action that you selected. You can also see a Request Performance Breakdown that will list different categories that make up the request, which also includes SQL queries performed in the request.
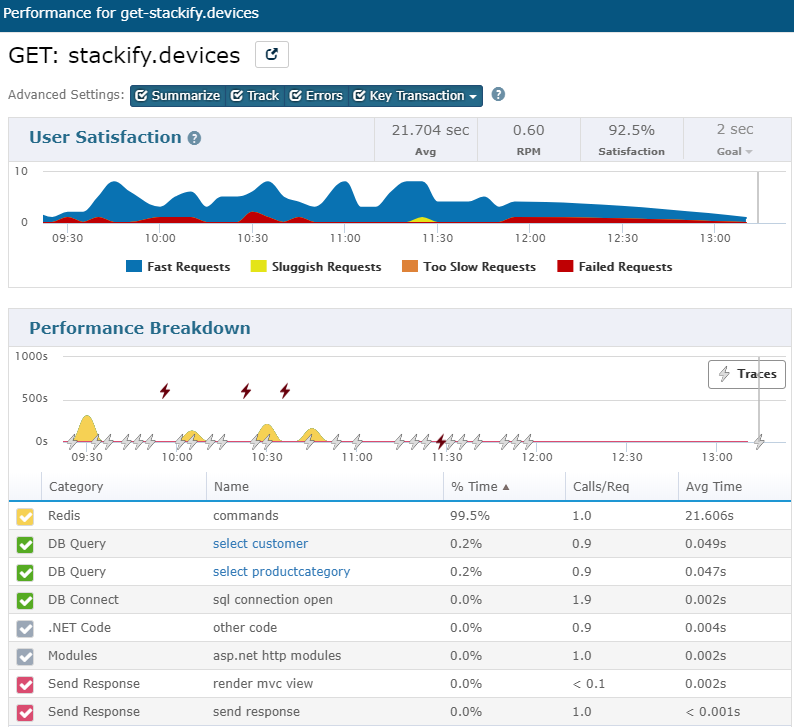
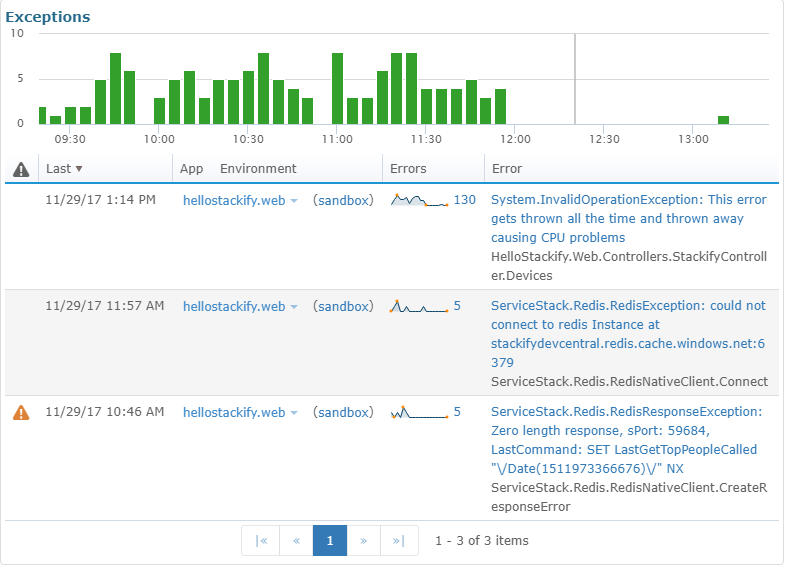
If any exceptions occurred for this requested action and you have Errors and Logs configured, you will see exceptions listed here as well.
Recent Traces for Selected Transaction
Performance Breakdown also displays the available traces in each request. Clicking on any available trace icon will give you more information on that particular trace. The colors correspond to how long the trace took- grey is under 200ms, orange is between 200 and 500ms, red is between 500 and 1 second, and a darker red is for all traces over 1 second.

There is also filter tabs for Traces that selects the Slowest, Fastest, and Latest Trace. All Traces lists every Trace that Retrace has captured. You can click on the occurrence of each individual trace to see the method call breakdown of that trace.

Once you select a Trace a chart is displayed highlighting different App components and comparing that particular trace with the average time period of the past 24 hours. Below that chart is a method call tree that organizes all the methods of the trace into a tree-like breakdown. Along with a breakdown of the stack trace is the % of time and total time each method took.
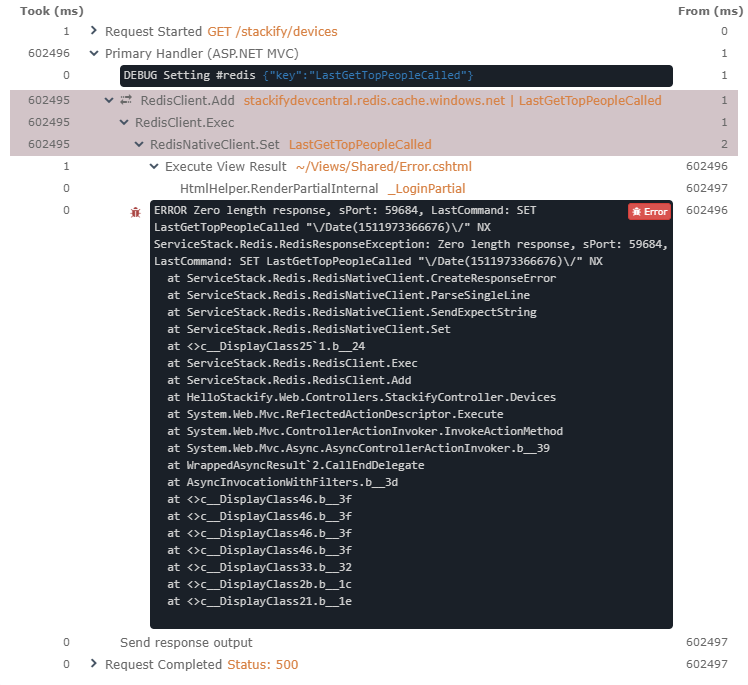
If you have Errors and Logs configured, any logging statements that are called within the trace will appear here inline in the method. If there are any exceptions listed in your trace, you can click on the red bug icon to view error details or you can expand any debug data to view the JSON document.
You can expand any SQL query sections that appear in the trace to see the query, or you can click on the link of SQL statement to see that query’s performance.

SQL Queries
The SQL Queries tab shows all SQL queries that have been found inside the request traces and can be sorted by a variety of fields. You can click into these queries to view more detailed information about it's performance and the originating requests. 
Web Services
The Web Services tab displays any external web calls and is sortable by a variety of fields. You can also click into these request to view more details about the request. 
Tracked Functions
Tracked Functions are an advanced feature of Retrace and have to be manually set up in your application code. Once they are configured to your app the functions specified will show here. To learn more about Tracked Functions view Performance: Tracked Functions 
Servers
The Servers tab lists the servers that are currently running the app as well as metrics around the requests directed to that server. You can click the server name to go to the Server Dashboard. 
Traces
The Traces tab shows all gathered traces and is sortable by a variety of fields. You can either click the Request name to view details on the trace or click the server name to go to the Server Dashboard. 