New vs Legacy Profiler
- 3 Minutes to read
- Print
- DarkLight
- PDF
New vs Legacy Profiler
- 3 Minutes to read
- Print
- DarkLight
- PDF
Article summary
Did you find this summary helpful?
Thank you for your feedback!
Stackify created a brand new .NET profiler when .NET Core on Linux was released. Over the last couple years we have also updated it to work on Windows and be our primary .NET profiler.
The new profiler has improved support for async/await scenarios and requires less CPU and memory overhead on the servers.
Any servers using our .NET profiler on Linux are using the new profiler. Clients before December of 2020 were using the old profiler and must manually switch to the new profiler. All clients after December 2020 received the new profiler by default.
What profiler am I using?
If you aren't sure which profiler you are using on Windows, you can tell by the following ways:
Check the Agent Stackify.ini File
On your server browse to the installation path of the agent and look for the NewProfiler setting in the Stackify.ini file. If it is NewProfiler=1, you should be using the new profiler on this server.
[Feature]
AttachAll=1
NewProfiler=1
RestartIIS=0
EnableProfiler=1
Check Windows Event Viewer
Access the Event Viewer on the server and access the Application Windows Logs. Look for messages with the source .NET Runtimewhich are logged every time a .NET profiler is potentially attached to a process.
If it says {cf0d821e-299b-5307-a3d8-b283c03916da} in the message, it is using the new profiler.
.NET Runtime version 4.0.30319.0 - The profiler has requested that the CLR instance not load the profiler into this process. Profiler CLSID: '{cf0d821e-299b-5307-a3d8-b283c03916da}'. Process ID (decimal): 7068. Message ID: [0x2516].
Environment Variables on the Server
You can also check by looking at the environment variables on the server from the command line. Although, this only works if the agent was installed with the option of attaching to all .NET processes on the server. Otherwise, the environment variables only show up for certain users. If the echo command returns no result, you can't validate it using this methodology.
C:\>echo %COR_PROFILER%
{cf0d821e-299b-5307-a3d8-b283c03916da}
If the value is {cf0d821e-299b-5307-a3d8-b283c03916da} you are using the new profiler. If it is {de70e25c-02b5-4556-a837-8aa6fe502668}, you are using the old profiler.
Switch to the New Profiler for All Applications
The Stackify support team can enable the new profiler to be the default for all of your servers. Before doing this, we recommend trying the new profiler in a pre-production environment or on some of your servers just to validate it works correctly with your application.
The only known issue with the latest profiler is it does not support .NET 3.5 - 4.5.1.
Once the change is completed by the support team, all Stackify agents must be restarted for it to take effect. After restarting the agents, you should wait about 60 seconds and then restart your applications. They should then be using the new profiler.
How to Manually Enable the New Profiler
First, stop the Stackify Monitoring Service and Stackify Health Service.
On Windows find the installation folder for the Stackify Retrace Monitoring Agent. This be located in C:\Program Files (x86)\Stackify. Then find the Stackify.ini file and modify it. You need to add or modify the line for NewProfiler to be equal to 1.
[Feature]
NewProfiler=1
You can the restart the agent and it will activate the new profiler. Please give it a minute or so to start back up. You will then need to restart your application for it to fully take effect.
Modify Deployment Scripts
If you are installing Retrace via command line, you can enable the new profiler by specifying NEWPROFILER=1 as a command line argument.
Azure App Services
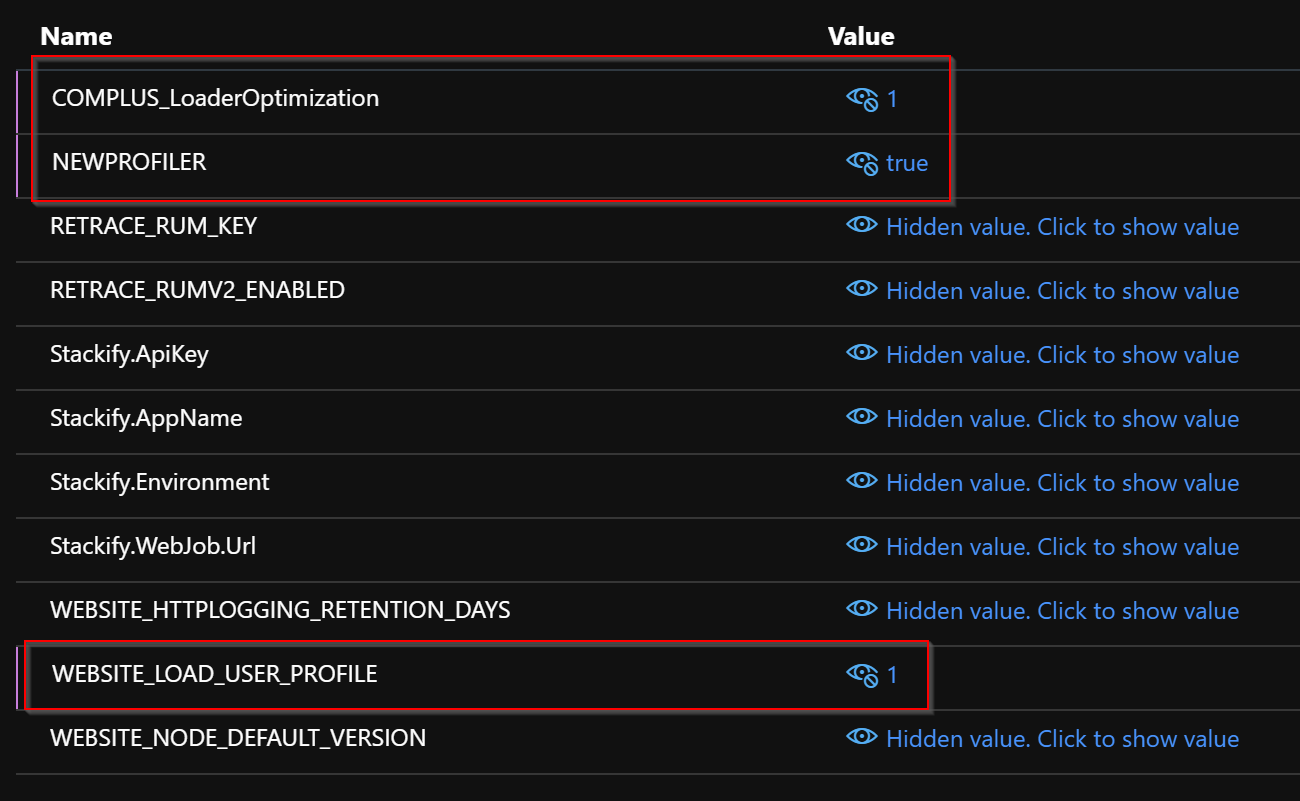
To use the new profiler with Azure App Services, you will have to modify some configuration values in the Azure portal.
You will need to set the following Application Settings:
| Variable Name | Value |
|---|---|
| COMPLUS_LoaderOptimization | 1 |
| NEWPROFILER | true |
| WEBSITE_LOAD_USER_PROFILE | 1 |
How to Force Using the Legacy Profiler
If you are using .NET 3.5, which is not supported by the new profiler, or a framework that is somehow not compatible with the new profiler, you can force the agent to install and use the old profiler.
First, stop the Stackify Monitoring Service and Stackify Health Service.
On Windows find the installation folder for the Stackify Retrace Monitoring Agent. This be located in C:\Program Files (x86)\Stackify. Then find the Stackify.ini file and modify it. You need to add or modify the line for LegacyProfiler to be equal to 1.
[Feature]
LegacyProfiler=1
You can then restart the agent and it will activate the legacy profiler. Please give it a minute or so to start back up. You will then need to restart your application for it to fully take effect.
We will soon provide a way to set this on the installer itself so it can be automated in deployments.
Was this article helpful?