Ensure optimal distributed transaction performance by using Distributed Tracing in Prefix Premium to ensure your code is performing optimally before QA and Production releases.
PREFIX PREMIUM is required for Distributed Transaction profiling and only available for .Net and Java applications at this time.
*Do you use another development language you’d like to use distributed transaction profiling with? Reach out to product@netreo.com and let us know what language(s) you develop in and how you’d like to use Prefix with your applications. *
Getting Started
Be sure to follow the getting started guide for Prefix and follow the correct download instructions for your operating system and configure your application for profiling by Prefix based on the correct application language. Please note that at this time, only the .Net and Java profilers have the ability to show Distributed Transactions and a Prefix Premium subscription is required.
What is Distributed Tracing?
Simply put, distributed tracing is the collecting of a set of traces that when linked together create business operations. We call this set of traces a distributed transaction. As an example, consider a customer on a website that finishes a purchase for an item. They hit submit, the server queues up the request to charge the customer and upon success of the charge, sends the order to another process that starts the shipping process for the order. You could consider all 3 items there part of a single transaction.
When we look at a transaction, at the highest level each individual server request is its own distinct trace. From the transaction level we call these spans. So a transaction is a set of related spans that perform some kind of business operation. There is an originating span that starts the whole transaction and then child spans of that originating one. There may be additional child spans or even additional sub transactions within as well. It can get complicated. This is where profiling tools like Prefix can help give insight into how the elements relate in a transaction.
What is Distributed Tracing in Prefix Premium?
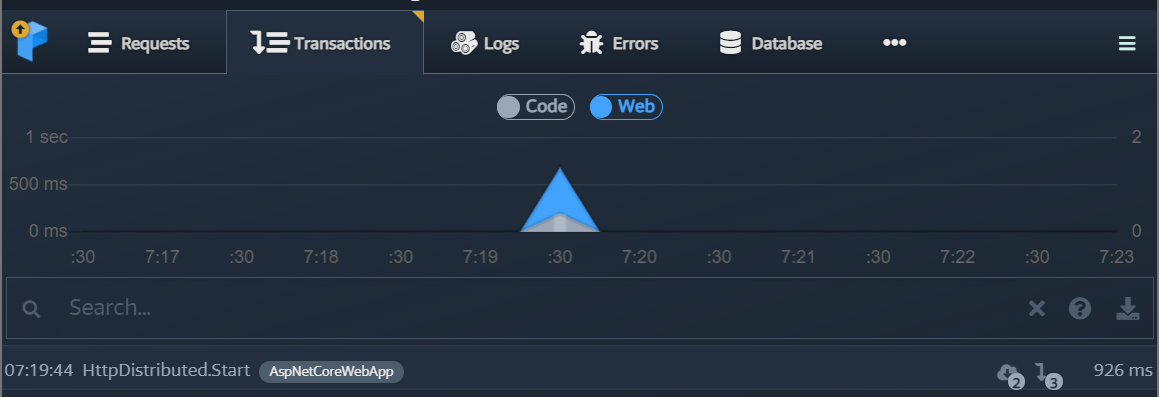
Prefix Premium will show you a distributed transaction in the Transactions tab of the app. Here there will be a list of the root-level requests that start a particular transaction Prefix profilers have identified. When a transaction is clicked, the distributed transaction trace will show in a right-hand panel. Here you can see the performance breakdown of the entire trace, a list of dependencies within the transaction, as well as the top level spans that make up the transaction.
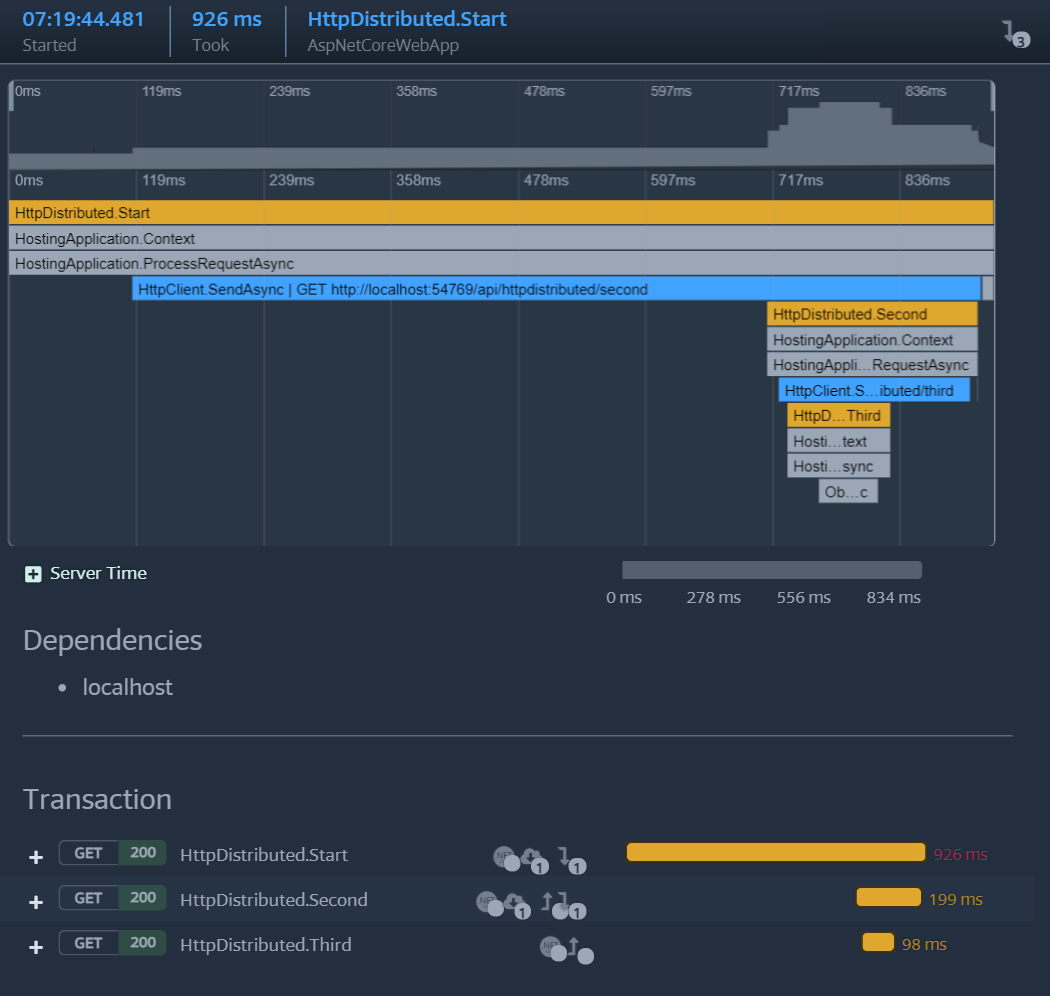
By expanding the spans, you will be able to see the code-level trace details that make up each child span or sub transactions within the transaction being viewed. The trace information will tell you how long each element took, what errors occurred, and what logs were collected at the time.
The Top Distributed Transactions and the Slowest Distributed Transactions can be viewed on the Summary Dashboard tab in the app to help you identify the most popular, and slower performing transactions for optimizations.
Seeing “MISSING” in the Trace breakdown
Visit our documentation here for information about the "missing" tag in a trace.