Monitoring is an integral part of application sustainability. Retrace’s Monitoring and Metrics reports show a complete picture of your application’s health. It showcases the effectiveness of alerts, custom application metrics, and satisfaction rating. Interpret this information correctly, and you will always be one step ahead of the next performance failure.
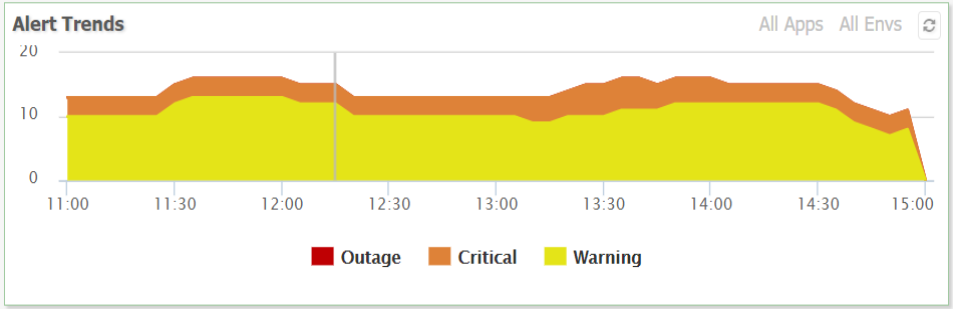
Active Alerts
See how many alerts you received over a specified period of time. Use Active Alerts to see a stacked chart where alerts are categorized by alert warnings, critical alerts, and alert outages. Check Active Alerts for a good idea of the status of your application.
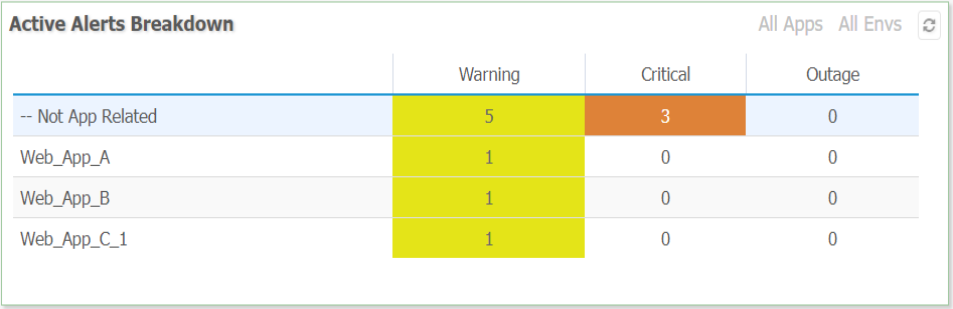
Alerts Breakdowns
Properly investigate issues using the Alert Breakdowns report that lists and categorize each alert individually. The number of alerts are broken down by the environment and are color-coded for ease of use.
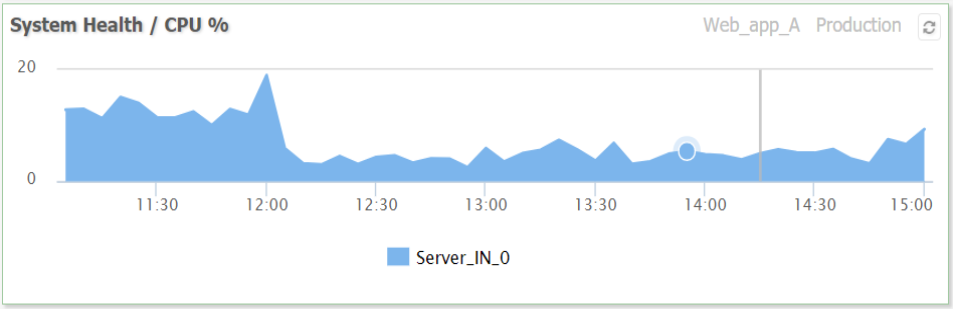
Application Metric
Create a custom report using the application metric of your choice. Metrics are divided into two options: system health or storage. System health has several options including server availability, CPU percentage, and Memory percentage. Storage reports allow you to monitor used space or the available free space versus the specified time. These metrics are presented by minimum, maximum, and average usage.
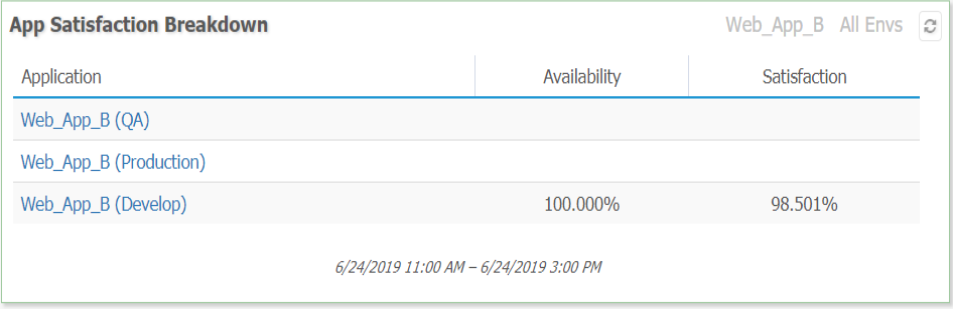
Application Satisfaction
Get a simple and quick representation of the availability and satisfaction rating of your application.
Timely reporting of alerts and breakdowns are vital for your application’s performance. Quickly see the success ratio by establishing CPU consumption and application satisfaction. Application monitoring ensures all applications are working as intended.