Navigate the Retrace dashboard and click on the Monitoring Tab. Click Log Queries.
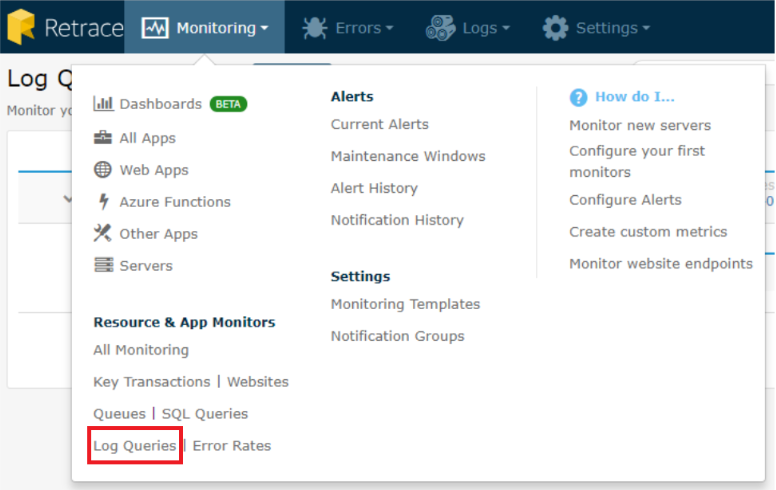
In the Log Queries screen, you can set up monitors for your Saved Log Searches. Here is a step-by-step process in configuring and implementing log query monitors.
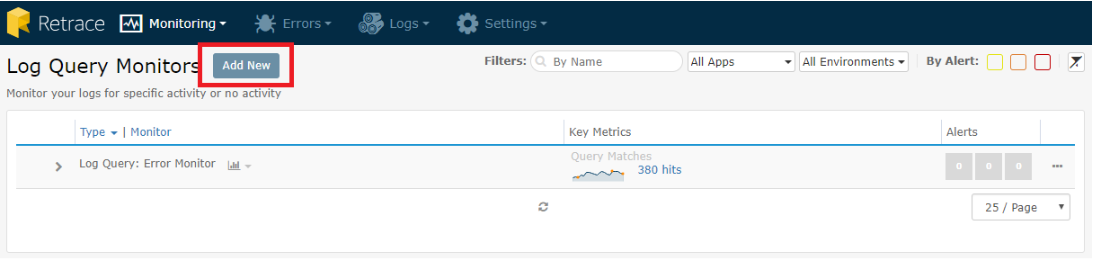
Add a New Monitor
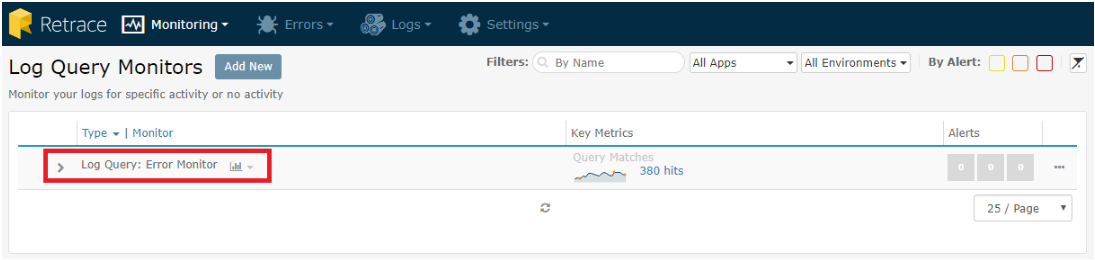
Upon clicking Log Queries, you will then be directed to the next page. To set up a new Log Query, click the Add New button as shown below:
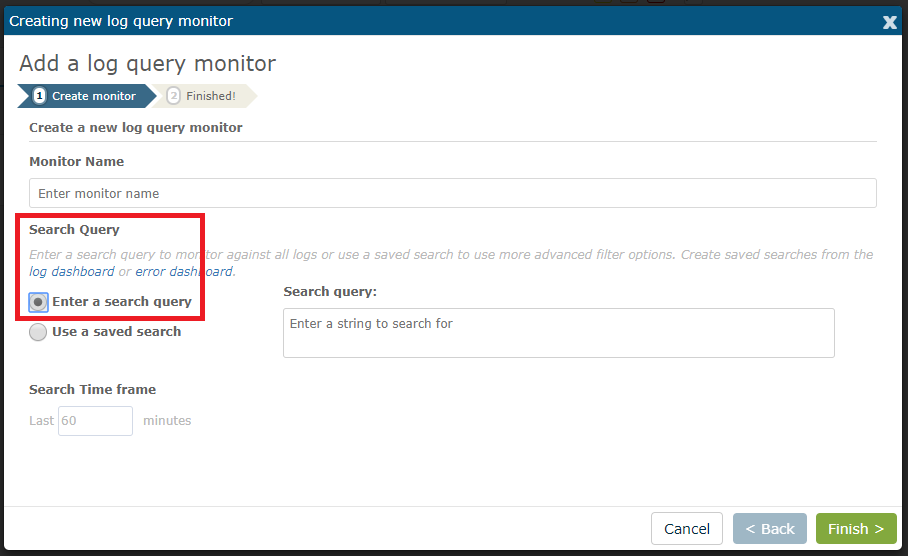
Configure Monitor Settings
There are two ways to monitor a log query: Search Query and Saved Query. For Search Query, you may use the search query box and enters strings of keywords.
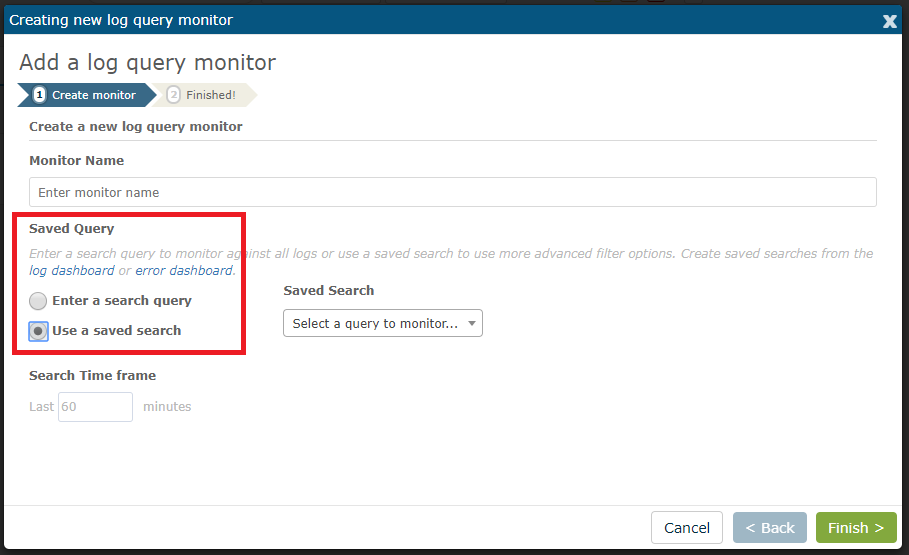
If in case you already created some queries, these are all saved and can be searched in the Logs Dashboard. If you want to monitor it, just select it from the drop-down list as shown below. Do not forget to create a name for the monitor. Also, you can assign a search time frame. This will determine the time span that query matches are checked.
Add Alerts to the Monitor
Once you are done with adding a log query monitor, you have the option to configure receiving alerts for query matches.
To configure, click on the left angle bracket as shown below:
The expanded page will lead you to this:
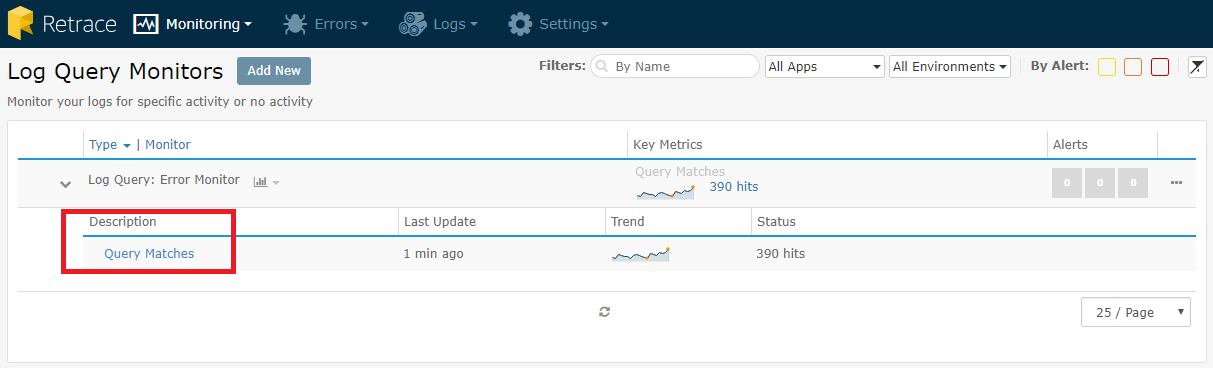
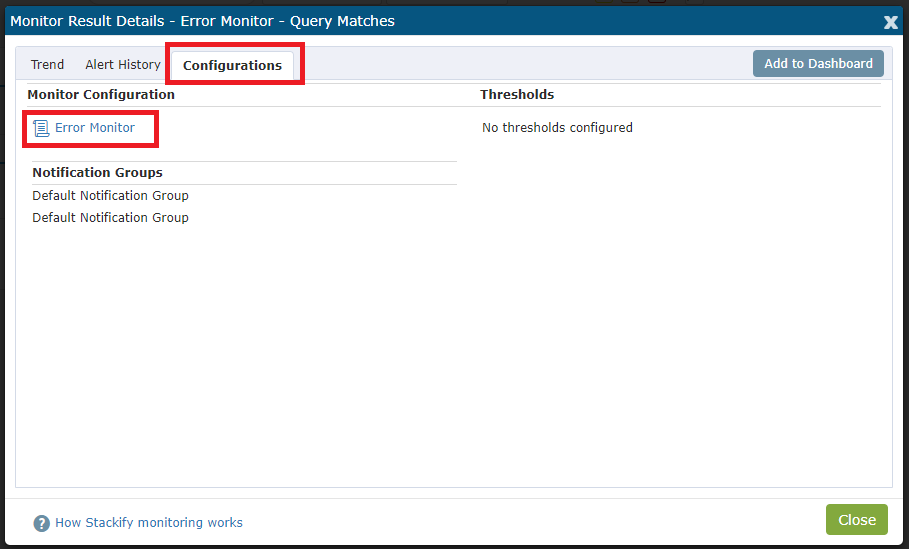
Click on the Query Matches and you will be directed to the page below. Select the Configuration tab and click on Error Monitor.
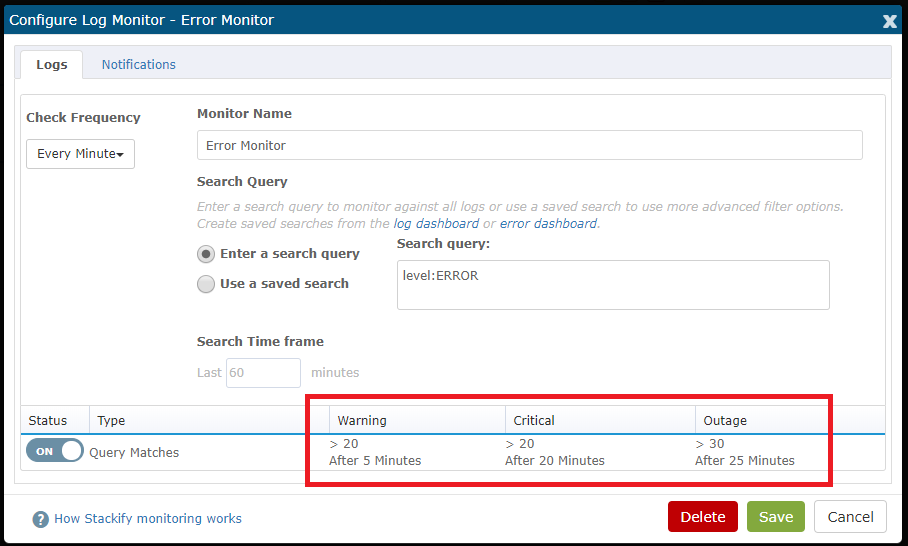
For example, this log monitor is configured to trigger a warning alert when 20 or more query matches occur within a 5-minute time span. You can also configure specific parameters for critical and outage alerts based on your application’s needs.
To see more information on setting up monitors in Retrace, be sure to check out Configuring Your First Monitors.